这是我之前提出问题的一个扩展:(请点击链接查看)。现在我无法扩展我的主面板高度。
以下是我的代码:
library(shiny)
library(shinydashboard)
library(shinyBS)
library(DT)

ui <- dashboardPage(
  dashboardHeader(),
  dashboardSidebar(
    sidebarPanel(
      textInput("text", "Enter Id:"),
      box(width = 1, background  = 'purple'),
      actionButton("Ok", "Press Ok",style='padding:8px; font-size:100%')
    )

  ),
  dashboardBody(

    mainPanel(width = 12,

      tabsetPanel(

        tabPanel("About", value=1, h6("The objective is to test width of ShinyApp in tabPanel design", br(),
                                      br(),

                                      "Distribution Prototype"

                                     )
                 ),


        tabPanel("Data", value=2,

                 fluidRow(

                   valueBoxOutput("vbox1", width = 2),
                   valueBoxOutput("vbox2", width = 2),
                   valueBoxOutput("vbox3", width = 2),
                   valueBoxOutput("vbox4", width = 2),
                   valueBoxOutput("vbox5", width = 2),
                   valueBoxOutput("vbox6", width = 2)


                 ),

                 fluidRow(

                   column(width = 4,  box(title = "Iris", width = NULL, solidHeader = FALSE, dataTableOutput("dat1"))),
                   column(width = 4,  box(title = "MT Cars", width = NULL, solidHeader = FALSE, dataTableOutput("dat2"))),
                   column(width = 4,  box(title = "Old Faithful Gyser", width = NULL, solidHeader = FALSE, dataTableOutput("dat3")))),

                 fluidRow(


                   column(width = 4,  box(title = "Plot1", width = NULL, solidHeader = FALSE, plotOutput("plot1", height = "600px"))),
                   column(width = 4,  box(title = "Plot2", width = NULL, solidHeader = FALSE, plotOutput("plot2", height = "600px"))),
                   column(width = 4,  box(title = "Plot3", width = NULL, solidHeader = FALSE, plotOutput("plot3", height = "600px")))


                 )

        )
      )
    )
  ))

server <- function(input, output) {

  output$vbox1 <- renderValueBox({ valueBox( "One","Yes",icon = icon("stethoscope"))})
  output$vbox2 <- renderValueBox({ valueBox( "Two","Yes",icon = icon("stethoscope"))})
  output$vbox3 <- renderValueBox({ valueBox( "Three","Yes",icon = icon("stethoscope"))})
  output$vbox4 <- renderValueBox({ valueBox( "Four","Yes",icon = icon("stethoscope"))})
  output$vbox5 <- renderValueBox({ valueBox( "Five","Yes",icon = icon("stethoscope"))})
  output$vbox6 <- renderValueBox({ valueBox( "Six","Yes",icon = icon("stethoscope"))})

  output$dat1 <- renderDataTable({datatable(iris)})
  output$dat2 <- renderDataTable({datatable(mtcars,extensions = 'Responsive' )})
  output$dat3 <- renderDataTable({datatable(faithful,rownames = FALSE, options = list(autoWidth = TRUE)  )})

}

shinyApp(ui, server)
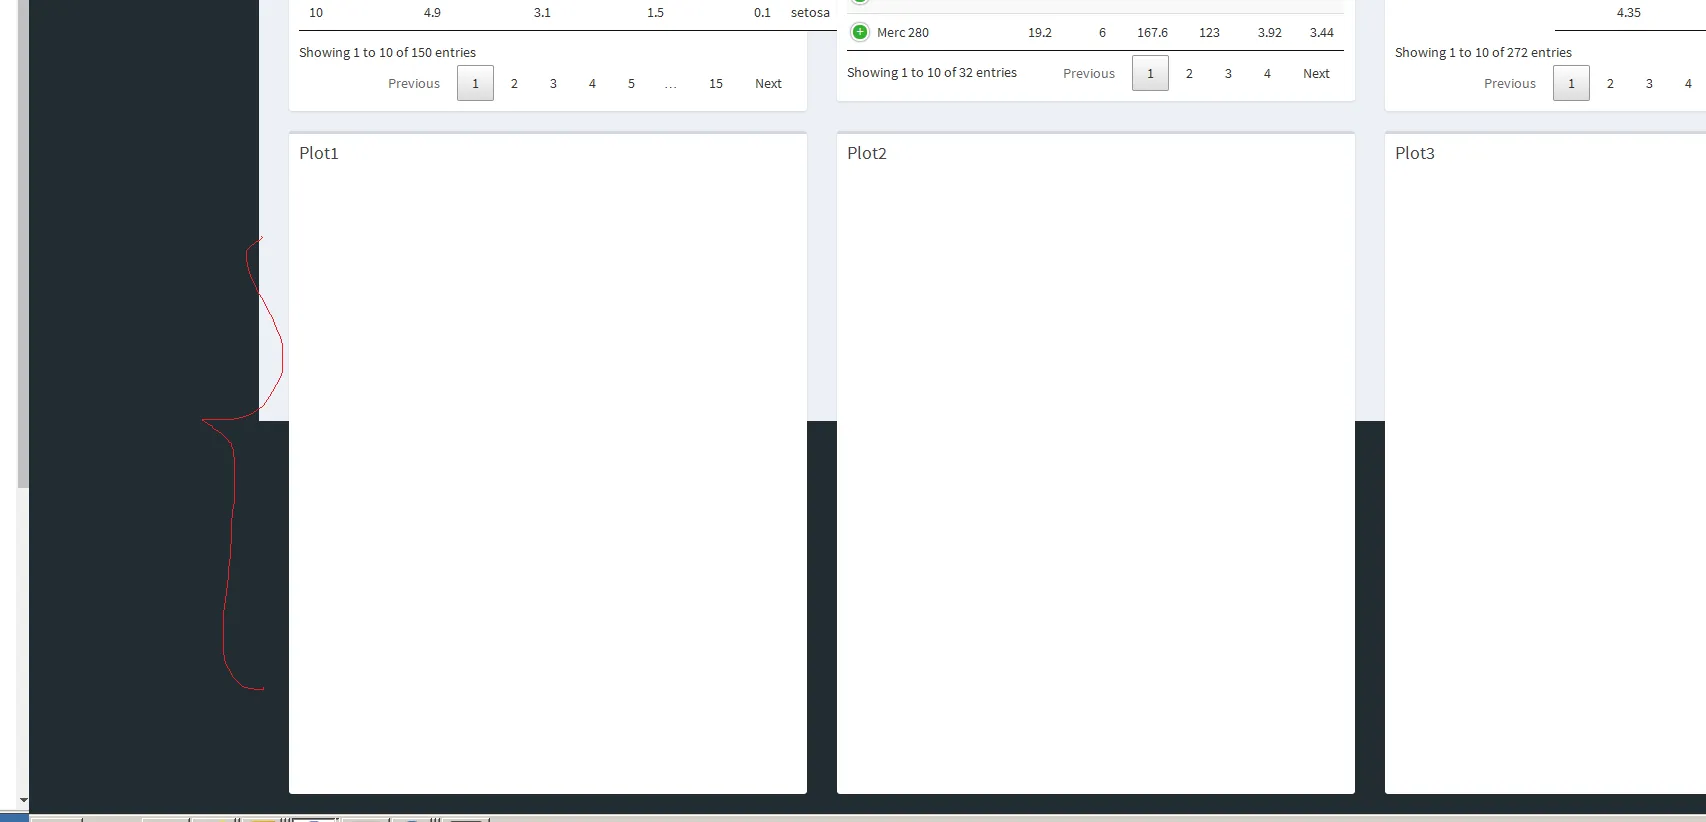
图表突出了默认布局空间,我在
mainPanel()中没有找到任何选项来增加高度。我尝试在mainPanel()中强制设置高度值,像这样:mainPanel(width = 12, height = 20 ....),但是没有起作用。非常感谢您的建议。+
 ---------更新------------
不确定是否有帮助,当我不使用
mainPanel()时,这不是一个问题。library(shiny)
library(shinydashboard)
library(DT)
ui <- dashboardPage(
dashboardHeader(title = "Dynamic boxes"),
dashboardSidebar(
conditionalPanel(condition="input.tabselected==3",
textInput("text", "Enter Id:"),
box(width = 1, background = 'purple'),
actionButton("Ok", "Press Ok",style='padding:8px; font-size:100%')
)
),
dashboardBody(
fluidRow(
valueBoxOutput("vbox1", width = 2),
valueBoxOutput("vbox2", width = 2),
valueBoxOutput("vbox3", width = 2),
valueBoxOutput("vbox4", width = 2),
valueBoxOutput("vbox5", width = 2),
valueBoxOutput("vbox6", width = 2)
),
fluidRow(
column(width = 4, box(title = "Iris", width = NULL, solidHeader = FALSE, dataTableOutput("dat1"))),
column(width = 4, box(title = "MT Cars", width = NULL, solidHeader = FALSE, dataTableOutput("dat2"))),
column(width = 4, box(title = "Old Faithful Gyser", width = NULL, solidHeader = FALSE, dataTableOutput("dat3")))
),
fluidRow(
column(width = 4, box(title = "Plot1 ", width = NULL, solidHeader = FALSE, plotOutput("plot1", height = "600px"))),
column(width = 4, box(title = "Plot2", width = NULL, solidHeader = FALSE, plotOutput("plot2", height = "600px"))),
column(width = 4, box(title = "Plot3", width = NULL, solidHeader = FALSE, plotOutput("plot3", height = "600px")))
)
)
)
server <- function(input, output) {
output$vbox1 <- renderValueBox({ valueBox( "One","Yes",icon = icon("stethoscope"))})
output$vbox2 <- renderValueBox({ valueBox( "Two","Yes",icon = icon("stethoscope"))})
output$vbox3 <- renderValueBox({ valueBox( "Three","Yes",icon = icon("stethoscope"))})
output$vbox4 <- renderValueBox({ valueBox( "Four","Yes",icon = icon("stethoscope"))})
output$vbox5 <- renderValueBox({ valueBox( "Five","Yes",icon = icon("stethoscope"))})
output$vbox6 <- renderValueBox({ valueBox( "Six","Yes",icon = icon("stethoscope"))})
output$dat1 <- renderDataTable({datatable(iris)})
output$dat2 <- renderDataTable({datatable(mtcars,extensions = 'Responsive' )})
output$dat3 <- renderDataTable({datatable(faithful,rownames = FALSE, options = list(autoWidth = TRUE) )})
#output$dat4 <- renderDataTable({datatable(data.frame(HairEyeColor),extensions = 'Responsive' )})
}
shinyApp(ui, server)
600px。 - Kevin Arseneau