Python - 寻找三维样条曲线上距离三维点最近的点

4

我有两个包含三维点(名称、X、Y、Z)的数组。第一个数组包含参考点,通过这些点我正在绘制样条线。第二个数组包含测量点,我需要从中计算法线,并获取法线在样条线上的坐标(我需要计算测量点的XY和高度标准偏差)。这是测试数据(实际上我有几千个点):

1号数组 - 参考点/生成样条线:

r1,1.5602,6.0310,4.8289
r2,1.6453,5.8504,4.8428
r3,1.7172,5.6732,4.8428
r4,1.8018,5.5296,4.8474
r5,1.8700,5.3597,4.8414

第二个数组 - 测量点:

m1, 1.8592, 5.4707, 4.8212
m2, 1.7642, 5.6362, 4.8441
m3, 1.6842, 5.7920, 4.8424
m4, 1.6048, 5.9707, 4.8465

我所编写的代码,用于读取数据,使用scipy计算样条曲线,然后通过matplotlib显示:
import numpy as np
import matplotlib.pyplot as plt
from scipy import interpolate

# import measured points
filename = "measpts.csv"
meas_pts = np.genfromtxt(filename, delimiter=',')

# import reference points
filename = "refpts.csv"
ref = np.genfromtxt(filename, delimiter=',')

# divide data to X, Y, Z
x = ref[:, 2]
y = ref[:, 1]
z = ref[:, 3]

# spline interpolation
tck, u = interpolate.splprep([x, y, z], s=0)
u_new = np.linspace(u.min(), u.max(), 1000000)
x_new, y_new, z_new = interpolate.splev(u_new, tck, der=0)

xs = tck[1][0]
ys = tck[1][1]
zs = tck[1][2]

# PLOT 3D
fig = plt.figure()
ax3d = fig.add_subplot(111, projection='3d', proj_type='ortho')
ax3d.plot(x, y, z, 'ro')     # ref points
ax3d.plot(xs, ys, zs, 'yo')     # spline knots
ax3d.plot(x_new, y_new, z_new, 'b--')     # spline
ax3d.plot(meas_pts[:, 2], meas_pts[:, 1], meas_pts[:, 3], 'g*')     # measured points

# ax3d.view_init(90, -90)     # 2D TOP view
# ax3d.view_init(0, -90)     # 2D from SOUTH to NORTH view
# ax3d.view_init(0, 0)     # 2D from EAST to WEST view

plt.show()

总结一下:我需要一个包含成对数据的数组:[[测量点 X,Y,Z],[样条曲线上最近(法)点的 X,Y,Z]]。
1个回答

4

给定一个三维空间中的点P和一条直线,点P到该直线上点的距离是长方体的对角线,因此你希望最小化这个对角线,最小距离将与该直线垂直。

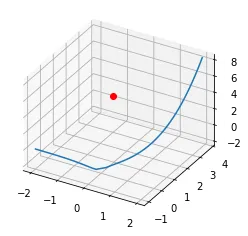
enter image description here

你可以利用这个特性。例如:

import numpy as np
import pandas as pd
import matplotlib.pyplot as plt

# generate sample line
x = np.linspace(-2, 2, 100)
y = np.cbrt( np.exp(2*x) -1 )
z = (y + 1) * (y - 2)
# a point
P = (-1, 3, 2)
# 3d plot
fig = plt.figure()
ax = fig.add_subplot(111, projection='3d', proj_type='ortho')
ax.plot(x, y, z)
ax.plot(P[0], P[1], P[2], 'or')
plt.show()

enter image description here

def distance_3d(x, y, z, x0, y0, z0):
    """
    3d distance from a point and a line
    """
    dx = x - x0
    dy = y - y0
    dz = z - z0
    d = np.sqrt(dx**2 + dy**2 + dz**2)
    return d

def min_distance(x, y, z, P, precision=5):
    """
    Compute minimum/a distance/s between
    a point P[x0,y0,z0] and a curve (x,y,z)
    rounded at `precision`.
    
    ARGS:
        x, y, z   (array)
        P         (3dtuple)
        precision (integer)
        
    Returns min indexes and distances array.
    """
    # compute distance
    d = distance_3d(x, y, z, P[0], P[1], P[2])
    d = np.round(d, precision)
    # find the minima
    glob_min_idxs = np.argwhere(d==np.min(d)).ravel()
    return glob_min_idxs, d

提供

的功能

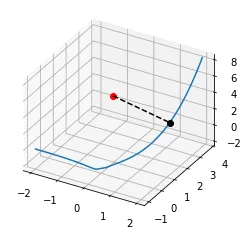
min_idx, d = min_distance(x, y, z, P)

fig = plt.figure()
ax = fig.add_subplot(111, projection='3d', proj_type='ortho')
ax.plot(x, y, z)
ax.plot(P[0], P[1], P[2], 'or')
ax.plot(x[min_idx], y[min_idx], z[min_idx], 'ok')
for idx in min_idx:
    ax.plot(
        [P[0], x[idx]],
        [P[1], y[idx]],
        [P[2], z[idx]],
        'k--'
    )
plt.show()

enter image description here

print("distance:", d[min_idx])

distance: [2.4721]

你可以根据自己的需求实现类似的功能。

网页内容由stack overflow 提供, 点击上面的
可以查看英文原文,
原文链接