我需要找到一种用Python并且最好使用Matplotlib和Pillow库,将一个正方形图像缩小至256个大像素的方法。
有任何想法吗?
我需要找到一种用Python并且最好使用Matplotlib和Pillow库,将一个正方形图像缩小至256个大像素的方法。
有任何想法吗?
经过九个月的时间,我现在可以拼凑一些Python代码 - 就像你最初要求的那样,使用Python和PIL/Pillow来对图像进行像素化处理。
#!/usr/local/bin/python3
from PIL import Image
# Open image
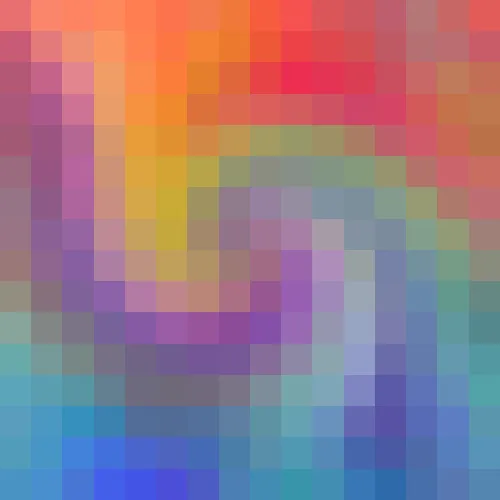
img = Image.open("artistic-swirl.jpg")
# Resize smoothly down to 16x16 pixels
imgSmall = img.resize((16,16), resample=Image.Resampling.BILINEAR)
# Scale back up using NEAREST to original size
result = imgSmall.resize(img.size, Image.Resampling.NEAREST)
# Save
result.save('result.png')
原始图片

结果
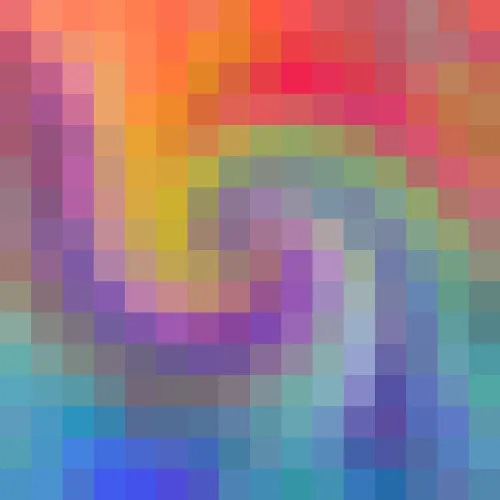
如果将其缩小到32x32像素(而不是16x16),然后再放大,就会得到:

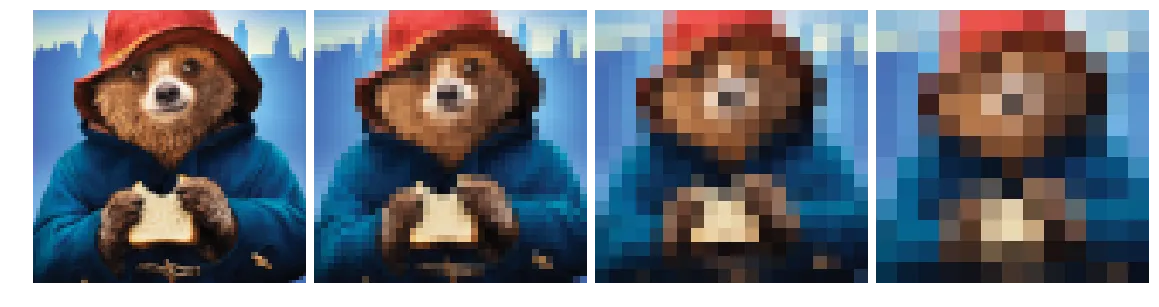
另一种选择是使用PyPXL
使用Lab colorspace中的K-Means聚类来像素化图像和视频的Python脚本。 视频像素化支持多进程以实现更好的性能。
使用Paddington图像作为源,您可以运行:
python pypxl_image.py -s 16 16 paddington.png paddington_pixelated.png
这将会得到以下结果

python pypxl_image.py -s 256 256 paddington.png paddington_pixelated.png
这将产生以下结果

与其他解决方案相比,这两个结果都具有更复古的8位外观,可能更适合您的需求。
import numpy as np
import matplotlib.pyplot as plt

def pixelate_rgb(img, window):
    n, m, _ = img.shape
    n, m = n - n % window, m - m % window
    img1 = np.zeros((n, m, 3))
    for x in range(0, n, window):
        for y in range(0, m, window):
            img1[x:x+window,y:y+window] = img[x:x+window,y:y+window].mean(axis=(0,1))
    return img1

img = plt.imread('test.png')

fig, ax = plt.subplots(1, 4, figsize=(20,10))

ax[0].imshow(pixelate_rgb(img, 5))
ax[1].imshow(pixelate_rgb(img, 10))
ax[2].imshow(pixelate_rgb(img, 20))
ax[3].imshow(pixelate_rgb(img, 30))

# remove frames
[a.set_axis_off() for a in ax.flatten()]
plt.subplots_adjust(wspace=0.03, hspace=0)
def pixelate_bin(img, window, threshold):
    n, m = img.shape
    n, m = n - n % window, m - m % window
    img1 = np.zeros((n,m))
    for x in range(0, n, window):
        for y in range(0, m, window):
            if img[x:x+window,y:y+window].mean() > threshold:
                img1[x:x+window,y:y+window] = 1
    return img1

# convert image to grayscale
img = np.dot(plt.imread('test.png'), [0.299 , 0.587, 0.114])

fig, ax = plt.subplots(1, 3, figsize=(15,10))

plt.tight_layout()
ax[0].imshow(pixelate_bin(img, 5, .2), cmap='gray')
ax[1].imshow(pixelate_bin(img, 5, .3), cmap='gray')
ax[2].imshow(pixelate_bin(img, 5, .45), cmap='gray')

# remove frames
[a.set_axis_off() for a in ax.flatten()]
plt.subplots_adjust(wspace=0.03, hspace=0)
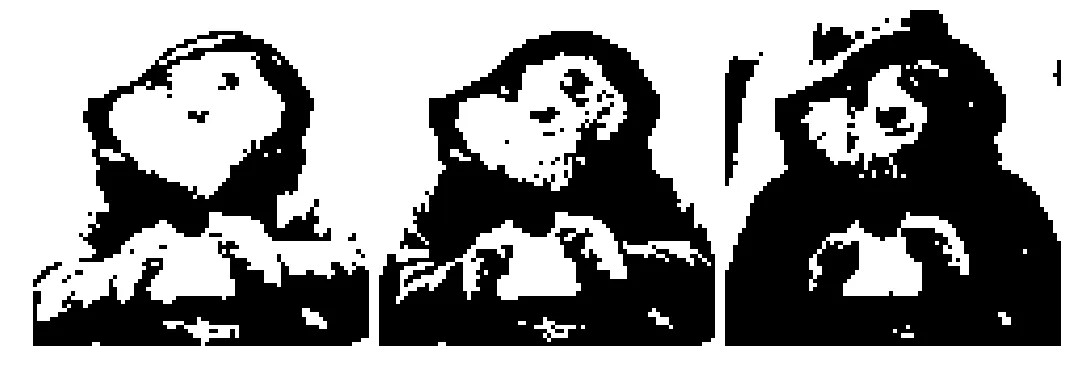
请注意:png的值在0和1之间,而jpg的值在0和255之间。
很抱歉,我不能为您提供Python解决方案,但我可以向您展示技术和结果,只需在命令行中使用ImageMagick:
从这个开始:

首先,使用正常的立方或双线性插值将图像缩小到16x16像素,然后再使用“最近邻”插值将图像缩放回其原始大小:
magick artistic-swirl.jpg -resize 16x16 -scale 500x500 result.png
关键词:
像素化、图像处理、最近邻插值、ImageMagick、命令行、命令行界面。