我有一组6x3的子图,其中两个子图总是相关的。我想将其中两个图之间的背景颜色(不是图本身的背景)更改为“连接”它们的视觉效果。
我尝试过使用矩形注释,但无法将其放置在图的后面。使用"uistack"也没有效果。即使使用"bottom"选项,矩形仍然在图的前面。
有没有办法在图的背景上绘制?
我尝试过使用矩形注释,但无法将其放置在图的后面。使用"uistack"也没有效果。即使使用"bottom"选项,矩形仍然在图的前面。
有没有办法在图的背景上绘制?
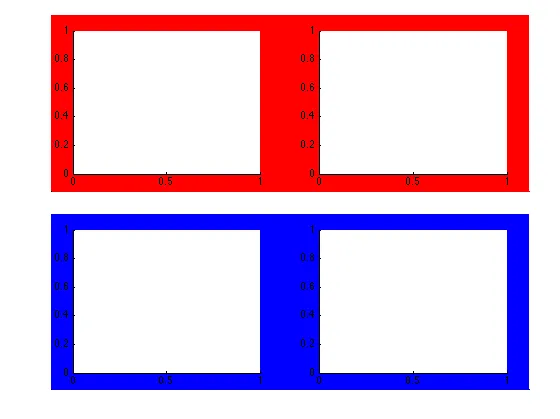
axes创建有背景颜色的坐标轴,并用uistack将其移至后面的小例子:figure
h1 = subplot(2,2,1);
h2 = subplot(2,2,2);
h3 = subplot(2,2,3);
h4 = subplot(2,2,4);
p1 = get(h1,'Position');
p2 = get(h2,'Position');
border = 0.3*p1(1);
x1 = p1(1)-border;
y1 = p1(2)-border;
width1 = p2(3)+p2(1)-p1(1)+2*border;
height1 = max(p1(4),p2(4))+2*border;
ax1 = axes('Position', [x y width1 height1],...
'Color','r','XTick',[],'XColor','r','YTick',[],'YColor','r');
uistack(ax1,'bottom')
p3 = get(h3,'Position');
p4 = get(h4,'Position');
border = 0.3*p3(1);
x2 = p3(1)-border;
y2 = p3(2)-border;
width2 = p4(3)+p4(1)-p3(1)+2*border;
height2 = max(p3(4),p4(4))+2*border;
ax2 = axes('Position', [x2 y2 width2 height2],...
'Color','b','XTick',[],'XColor','b','YTick',[],'YColor','b');
uistack(ax2,'bottom')
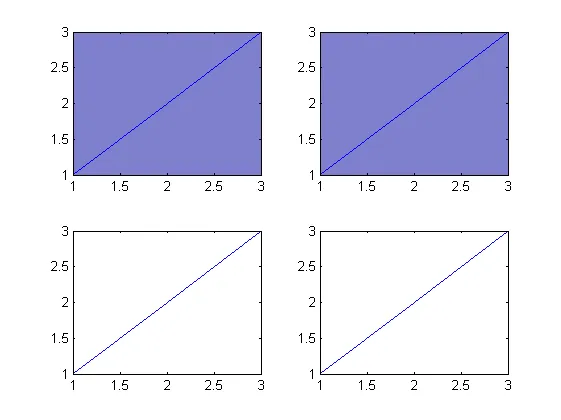
Color属性设置为您喜欢的颜色。例如:subplot(2,2,1)
plot(1:3,1:3) % example plot
set(gca,'Color',[.5 .5 .8]) % set background color
subplot(2,2,2)
plot(1:3,1:3)
set(gca,'Color',[.5 .5 .8]) % set background color
subplot(2,2,3)
plot(1:3,1:3)
subplot(2,2,4)
plot(1:3,1:3)