Matlab专门设计用来使绘图等操作尽可能简单,其他语言并没有同样快速、简单绘图的支持。
因此,我决定为你编写一个基于JFreeChart的小型类似Matlab风格的图表类:
import java.awt.BasicStroke;
import java.awt.Color;
import java.awt.Font;
import java.awt.Stroke;
import java.io.File;
import java.io.IOException;
import java.util.ArrayList;
import org.jfree.chart.ChartFactory;
import org.jfree.chart.ChartUtilities;
import org.jfree.chart.JFreeChart;
import org.jfree.chart.annotations.XYTitleAnnotation;
import org.jfree.chart.axis.NumberAxis;
import org.jfree.chart.block.BlockBorder;
import org.jfree.chart.plot.PlotOrientation;
import org.jfree.chart.plot.XYPlot;
import org.jfree.chart.title.LegendTitle;
import org.jfree.data.xy.XYSeries;
import org.jfree.data.xy.XYSeriesCollection;
import org.jfree.ui.RectangleAnchor;
import org.jfree.ui.RectangleEdge;
public class MatlabChart {
Font font;
JFreeChart chart;
LegendTitle legend;
ArrayList<Color> colors;
ArrayList<Stroke> strokes;
XYSeriesCollection dataset;
public MatlabChart() {
font = JFreeChart.DEFAULT_TITLE_FONT;
colors = new ArrayList<Color>();
strokes = new ArrayList<Stroke>();
dataset = new XYSeriesCollection();
}
public void plot(double[] x, double[] y, String spec, float lineWidth, String title) {
final XYSeries series = new XYSeries(title);
for (int i = 0; i < x.length; i++)
series.add(x[i],y[i]);
dataset.addSeries(series);
FindColor(spec,lineWidth);
}
public void RenderPlot() {
JFreeChart chart = null;
if (dataset != null && dataset.getSeriesCount() > 0)
chart = ChartFactory.createXYLineChart(null,null,null,dataset,PlotOrientation.VERTICAL,true, false, false);
else
System.out.println(" [!] First create a chart and add data to it. The plot is empty now!");
XYPlot plot = chart.getXYPlot();
for (int i = 0; i < colors.size(); i++) {
plot.getRenderer().setSeriesPaint(i, colors.get(i));
plot.getRenderer().setSeriesStroke(i, strokes.get(i));
}
((NumberAxis)plot.getDomainAxis()).setAutoRangeIncludesZero(false);
((NumberAxis)plot.getRangeAxis()).setAutoRangeIncludesZero(false);
plot.setBackgroundPaint(Color.WHITE);
legend = chart.getLegend();
chart.removeLegend();
this.chart = chart;
}
public void CheckExists() {
if (chart == null) {
throw new IllegalArgumentException("First plot something in the chart before you modify it.");
}
}
public void font(String name, int fontSize) {
CheckExists();
font = new Font(name, Font.PLAIN, fontSize);
chart.getTitle().setFont(font);
chart.getXYPlot().getDomainAxis().setLabelFont(font);
chart.getXYPlot().getDomainAxis().setTickLabelFont(font);
chart.getXYPlot().getRangeAxis().setLabelFont(font);
chart.getXYPlot().getRangeAxis().setTickLabelFont(font);
legend.setItemFont(font);
}
public void title(String title) {
CheckExists();
chart.setTitle(title);
}
public void xlim(double l, double u) {
CheckExists();
chart.getXYPlot().getDomainAxis().setRange(l, u);
}
public void ylim(double l, double u) {
CheckExists();
chart.getXYPlot().getRangeAxis().setRange(l, u);
}
public void xlabel(String label) {
CheckExists();
chart.getXYPlot().getDomainAxis().setLabel(label);
}
public void ylabel(String label) {
CheckExists();
chart.getXYPlot().getRangeAxis().setLabel(label);
}
public void legend(String position) {
CheckExists();
legend.setItemFont(font);
legend.setBackgroundPaint(Color.WHITE);
legend.setFrame(new BlockBorder(Color.BLACK));
if (position.toLowerCase().equals("northoutside")) {
legend.setPosition(RectangleEdge.TOP);
chart.addLegend(legend);
} else if (position.toLowerCase().equals("eastoutside")) {
legend.setPosition(RectangleEdge.RIGHT);
chart.addLegend(legend);
} else if (position.toLowerCase().equals("southoutside")) {
legend.setPosition(RectangleEdge.BOTTOM);
chart.addLegend(legend);
} else if (position.toLowerCase().equals("westoutside")) {
legend.setPosition(RectangleEdge.LEFT);
chart.addLegend(legend);
} else if (position.toLowerCase().equals("north")) {
legend.setPosition(RectangleEdge.TOP);
XYTitleAnnotation ta = new XYTitleAnnotation(0.50,0.98,legend,RectangleAnchor.TOP);
chart.getXYPlot().addAnnotation(ta);
} else if (position.toLowerCase().equals("northeast")) {
legend.setPosition(RectangleEdge.TOP);
XYTitleAnnotation ta = new XYTitleAnnotation(0.98,0.98,legend,RectangleAnchor.TOP_RIGHT);
chart.getXYPlot().addAnnotation(ta);
} else if (position.toLowerCase().equals("east")) {
legend.setPosition(RectangleEdge.RIGHT);
XYTitleAnnotation ta = new XYTitleAnnotation(0.98,0.50,legend,RectangleAnchor.RIGHT);
chart.getXYPlot().addAnnotation(ta);
} else if (position.toLowerCase().equals("southeast")) {
legend.setPosition(RectangleEdge.BOTTOM);
XYTitleAnnotation ta = new XYTitleAnnotation(0.98,0.02,legend,RectangleAnchor.BOTTOM_RIGHT);
chart.getXYPlot().addAnnotation(ta);
} else if (position.toLowerCase().equals("south")) {
legend.setPosition(RectangleEdge.BOTTOM);
XYTitleAnnotation ta = new XYTitleAnnotation(0.50,0.02,legend,RectangleAnchor.BOTTOM);
chart.getXYPlot().addAnnotation(ta);
} else if (position.toLowerCase().equals("southwest")) {
legend.setPosition(RectangleEdge.BOTTOM);
XYTitleAnnotation ta = new XYTitleAnnotation(0.02,0.02,legend,RectangleAnchor.BOTTOM_LEFT);
chart.getXYPlot().addAnnotation(ta);
} else if (position.toLowerCase().equals("west")) {
legend.setPosition(RectangleEdge.LEFT);
XYTitleAnnotation ta = new XYTitleAnnotation(0.02,0.50,legend,RectangleAnchor.LEFT);
chart.getXYPlot().addAnnotation(ta);
} else if (position.toLowerCase().equals("northwest")) {
legend.setPosition(RectangleEdge.TOP);
XYTitleAnnotation ta = new XYTitleAnnotation(0.02,0.98,legend,RectangleAnchor.TOP_LEFT);
chart.getXYPlot().addAnnotation(ta);
}
}
public void grid(String xAxis, String yAxis) {
CheckExists();
if (xAxis.equalsIgnoreCase("on")){
chart.getXYPlot().setDomainGridlinesVisible(true);
chart.getXYPlot().setDomainMinorGridlinesVisible(true);
chart.getXYPlot().setDomainGridlinePaint(Color.GRAY);
} else {
chart.getXYPlot().setDomainGridlinesVisible(false);
chart.getXYPlot().setDomainMinorGridlinesVisible(false);
}
if (yAxis.equalsIgnoreCase("on")){
chart.getXYPlot().setRangeGridlinesVisible(true);
chart.getXYPlot().setRangeMinorGridlinesVisible(true);
chart.getXYPlot().setRangeGridlinePaint(Color.GRAY);
} else {
chart.getXYPlot().setRangeGridlinesVisible(false);
chart.getXYPlot().setRangeMinorGridlinesVisible(false);
}
}
public void saveas(String fileName, int width, int height) {
CheckExists();
File file = new File(fileName);
try {
ChartUtilities.saveChartAsJPEG(file,this.chart,width,height);
} catch (IOException e) {
e.printStackTrace();
}
}
public void FindColor(String spec, float lineWidth) {
float dash[] = {5.0f};
float dot[] = {lineWidth};
Color color = Color.RED;
Stroke stroke = new BasicStroke(lineWidth);
if (spec.contains("-"))
stroke = new BasicStroke(lineWidth);
else if (spec.contains(":"))
stroke = new BasicStroke(lineWidth, BasicStroke.CAP_BUTT, BasicStroke.JOIN_MITER, 10.0f, dash, 0.0f);
else if (spec.contains("."))
stroke = new BasicStroke(lineWidth, BasicStroke.CAP_BUTT, BasicStroke.JOIN_MITER, 2.0f, dot, 0.0f);
if (spec.contains("y"))
color = Color.YELLOW;
else if (spec.contains("m"))
color = Color.MAGENTA;
else if (spec.contains("c"))
color = Color.CYAN;
else if (spec.contains("r"))
color = Color.RED;
else if (spec.contains("g"))
color = Color.GREEN;
else if (spec.contains("b"))
color = Color.BLUE;
else if (spec.contains("k"))
color = Color.BLACK;
colors.add(color);
strokes.add(stroke);
}
}
使用这个工具,你可以使用非常接近Matlab的语法在Java中进行绘图:
public class Demo {
public static void main(String[] args) {
double[] x = new double[100]; x[0] = 1;
double[] y1 = new double[100]; y1[0] = 200;
double[] y2 = new double[100]; y2[0] = 300;
for(int i = 1; i < x.length; i++){
x[i] = i+1;
y1[i] = y1[i-1] + Math.random()*10 - 4;
y2[i] = y2[i-1] + Math.random()*10 - 6;
}
MatlabChart fig = new MatlabChart();
fig.plot(x, y1, "-r", 2.0f, "AAPL");
fig.plot(x, y2, ":k", 3.0f, "BAC");
fig.RenderPlot();
fig.title("Stock 1 vs. Stock 2");
fig.xlim(10, 100);
fig.ylim(200, 300);
fig.xlabel("Days");
fig.ylabel("Price");
fig.grid("on","on");
fig.legend("northeast");
fig.font("Helvetica",15);
fig.saveas("MyPlot.jpeg",640,480);
}
}
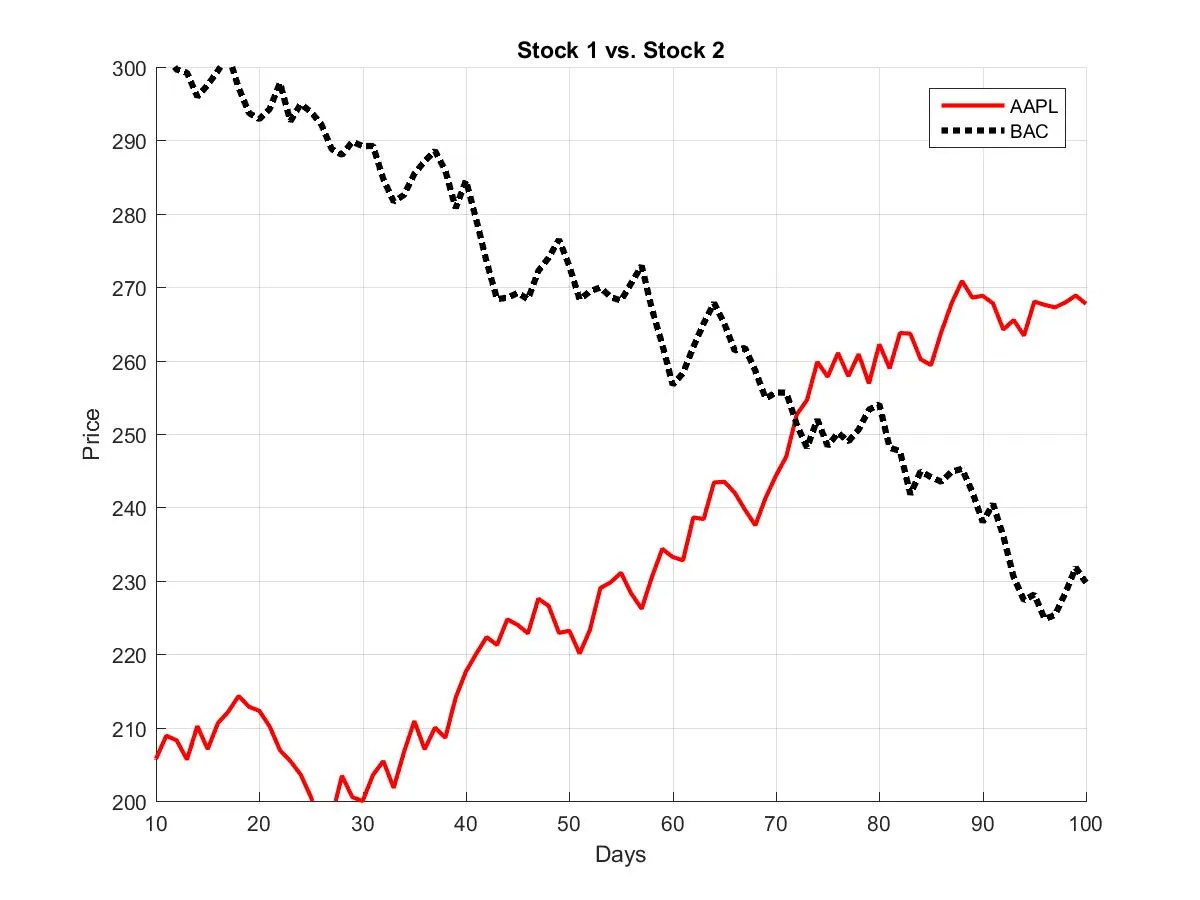
现在我们可以将最终的JFreeChart图与从以下代码获得的同一Matlab图进行比较:
figure('Position',[100 100 640 480]); hold all;
plot(x,y1,'-r','LineWidth',2);
plot(x,y2,':k','LineWidth',3);
title('Stock 1 vs. Stock 2');
xlim([10 100]);
ylim([200 300]);
xlabel('Days');
ylabel('Price');
grid on;
legend('AAPL','BAC','Location','northeast');
saveas(gcf,'MyPlot','jpeg');
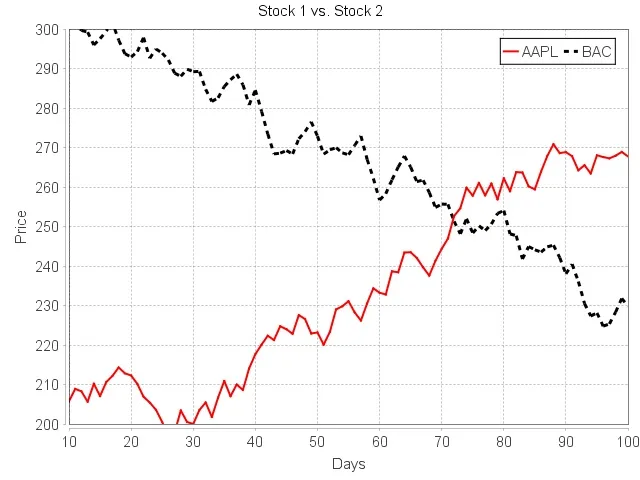
Java结果(使用MatlabChart()类):
Matlab结果:
我编写的MatlabChart()类支持一些基本绘图语法,您可以指定线条样式(:,-,.),更改线条颜色(y,m,c,r,g,b,w,k),更改LineWidth和更改图例的位置(northoutside,eastoutside,soutoutside,westoutside,north,east,south,west,northeast,southeast,southwest,northwest)。 您还可以独立地为x轴和y轴打开grid。例如:grid("off","on");将关闭x轴网格并打开y轴网格。
这应该会让在Java中绘图更容易,适用于那些习惯于使用Matlab绘图的人们:)