如何根据y轴值的正负更改MPAndroidChart折线图的线条和填充颜色

6

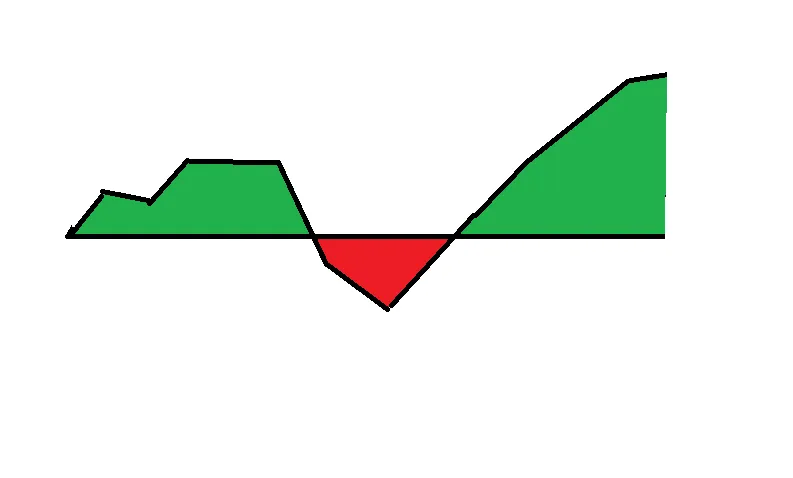
想知道是否可以根据y轴值的正负来更改线图的线条和填充颜色。以下是一个示例:
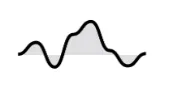
enter image description here

以下是使用以下代码能够实现的效果:

enter image description here

    private fun setUpLineChart() {
        val lineData = getDataSet()
        view.lineChart.apply {
            data = lineData
            description.isEnabled = false
            setScaleEnabled(false)
            setTouchEnabled(false)
            legend.isEnabled = false
            axisLeft.apply {
                setDrawLabels(false)
                setDrawGridLines(false)
                setDrawAxisLine(false)
                spaceBottom = 30f
            }
            axisRight.apply {
                setDrawLabels(false)
                setDrawGridLines(false)
                setDrawAxisLine(false)
            }
            xAxis.apply {
                setDrawLabels(false)
                setDrawGridLines(false)
                setDrawAxisLine(false)
            }
            animateXY(700, 1000, Easing.EaseInOutQuad)
        }
    }

    private fun getDataSet(): LineData {
        val entries = mutableListOf<Entry>()
        val dataList = listOf(1, 20, -20, 33, 54, 7, -18, 2)

        dataList.forEachIndexed { index, element ->
            entries.add(Entry(index.toFloat(), element.toFloat()))
        }

        val dataSet = LineDataSet(entries, "")
        dataSet.apply {
            setDrawCircles(false)
            valueTextSize = 0f
            lineWidth = 3f
            mode = LineDataSet.Mode.HORIZONTAL_BEZIER
            color = ContextCompat.getColor(view.context, R.color.colorOnSurface)
            setDrawFilled(true)
            fillColor = ContextCompat.getColor(view.context, R.color.colorSurface2)
        }
        return LineData(dataSet)
    }
1个回答

4
线条和填充颜色绑定到特定的LineDataSet上。因此,根据上面的例子,为了实现您想要的结果,您需要将当前的数据集分成4个LineDataSet(2个正数和2个负数),这样每个数据集就可以有自己的填充和线条颜色,并且您可以灵活地使用每个数据集所需的颜色。当然,您需要自行编写逻辑来将正数LineDataSet与负数LineDataSet分开。我已经修改了您的getDataSet()函数,以向您演示如何实现正数LineDataSet与负数LineDataSet的分离,每个数据集都有自己的线条和填充颜色。
private fun getDataSet(): LineData? {
        val dataSets: MutableList<ILineDataSet> = ArrayList()
        val yArray = floatArrayOf(1f, 20f, -20f, 33f, 54f, 7f, -18f, 2f)
        var entries = ArrayList<Entry?>()
        var prevValueIsPositive = false
        var prevValueIsNegative = false
        val step = 1f
        for (i in yArray.indices) {
            val y = yArray[i]
            //positive y values
            if (y >= 0) {
                //we are changing to positive values so draw the current negative dataSets
                if (prevValueIsNegative) {
                    //calculate the common mid point between a positive and negative y
                    val midEntry = Entry(i.toFloat() - step / 2, 0f)
                    entries.add(midEntry)

                    //draw the current negative dataSet to Red color
                    dataSets.add(getLineDataSet(entries, android.R.color.holo_red_dark, android.R.color.holo_purple))

                    //and initialize a new DataSet starting from the above mid point Entry
                    entries = ArrayList()
                    entries.add(midEntry)
                    prevValueIsNegative = false
                }

                //we are already in a positive dataSet continue adding positive y values
                entries.add(Entry(i.toFloat(), y))
                prevValueIsPositive = true
                //not having any other positive-negative changes so add the remaining positive values in the final dataSet
                if (i == yArray.size - 1) {
                    dataSets.add(getLineDataSet(entries, android.R.color.holo_green_light, android.R.color.holo_orange_dark))
                }
            } else {
                //we are changing to negative values so draw the current positive dataSets
                if (prevValueIsPositive) {
                    //calculate the common mid point between a positive and negative y
                    val midEntry = Entry(i.toFloat() - step / 2, 0f)
                    entries.add(midEntry)

                    //draw the current positive dataSet to Green color
                    dataSets.add(getLineDataSet(entries, android.R.color.holo_green_light, android.R.color.holo_orange_dark))

                    //and initialize a new DataSet starting from the above mid point Entry
                    entries = ArrayList()
                    entries.add(midEntry)
                    prevValueIsPositive = false
                }

                //we are already in a negative dataSet continue adding negative y values
                entries.add(Entry(i.toFloat(), y))
                prevValueIsNegative = true
                //not having any other positive-negative changes so add the remaining negative values in the final dataSet
                if (i == yArray.size - 1) {
                    dataSets.add(getLineDataSet(entries, android.R.color.holo_red_dark, android.R.color.holo_purple))
                }
            }
        }
        return LineData(dataSets)
    }

使用下面的辅助函数,准备一个新的LineDataSet,并指定其线条和填充颜色:
private fun getLineDataSet(entries: ArrayList<Entry?>, fillColor: Int, lineColor: Int): LineDataSet {
        val dataSet = LineDataSet(entries, "")
        dataSet.setDrawCircles(false)
        dataSet.valueTextSize = 0f
        dataSet.lineWidth = 3f
        dataSet.mode = LineDataSet.Mode.HORIZONTAL_BEZIER
        dataSet.color = ContextCompat.getColor(this, lineColor)
        dataSet.setDrawFilled(true)
        dataSet.fillColor = ContextCompat.getColor(this, fillColor)
        return dataSet
    }

网页内容由stack overflow 提供, 点击上面的
可以查看英文原文,
原文链接