GraphView Android,如何更改原始x轴和y轴的线条粗细?

3

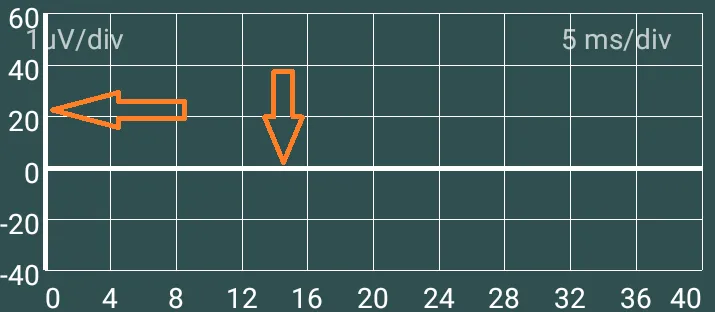
我在 Android 应用中使用 GraphView 库来绘制图表,目前我对这个库非常满意。我将它用于固定框架的实时场景,并注意到 x 轴和 y 轴网格线比其他单位网格线更粗。有没有办法让它们与其他线条相似?

GraphView graph = (GraphView) cardView.findViewById(R.id.graph);

// Set manual X bounds
graph.getViewport().setXAxisBoundsManual(true);
graph.getViewport().setMinX(0);
graph.getViewport().setMaxX(40);

// Set manual Y bounds
graph.getViewport().setYAxisBoundsManual(true);
graph.getViewport().setMinY(-40);
graph.getViewport().setMaxY(60);

// Draw a border between between labels and viewport
graph.getViewport().setDrawBorder(false);

graph.getGridLabelRenderer().setHumanRounding(false);
graph.getGridLabelRenderer().setNumHorizontalLabels(11);
graph.getGridLabelRenderer().setNumVerticalLabels(6);
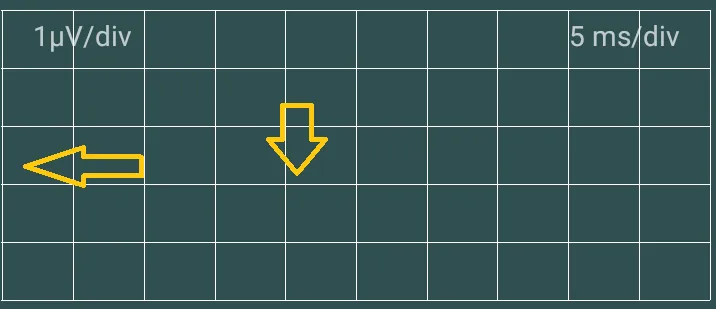
基本上我想要更改这个:

enter image description here

为这个:

enter image description here

提前感谢!
2个回答

4

GridLabelRenderer类有一个名为setHighlightZeroLines的方法,默认值为true。如果您需要禁用此功能,请使用以下代码:

graphView.getGridLabelRenderer().setHighlightZeroLines(false);

这样就可以实现您想要的效果。


1
请详细了解折线图系列:

折线图系列详解

// 系列样式

series.setTitle("Random Curve 1");
series.setColor(Color.GREEN);
series.setDrawDataPoints(true);
series.setDataPointsRadius(10);
series.setThickness(8);

// 自定义绘制方法,用于绘制虚线

Paint paint = new Paint();
paint.setStyle(Paint.Style.STROKE);
paint.setStrokeWidth(10);
paint.setPathEffect(new DashPathEffect(new float[]{8, 5}, 0));
series2.setCustomPaint(paint);

谢谢您的回复,但是您所提到的是用于修改数据系列(图形轨迹),而不是我正在寻找的网格线。我为了澄清已经编辑了图片。 - svahidhoss

网页内容由stack overflow 提供, 点击上面的
可以查看英文原文,
原文链接