如何在MPAndroidChart中更改Y轴标签的间距?

3
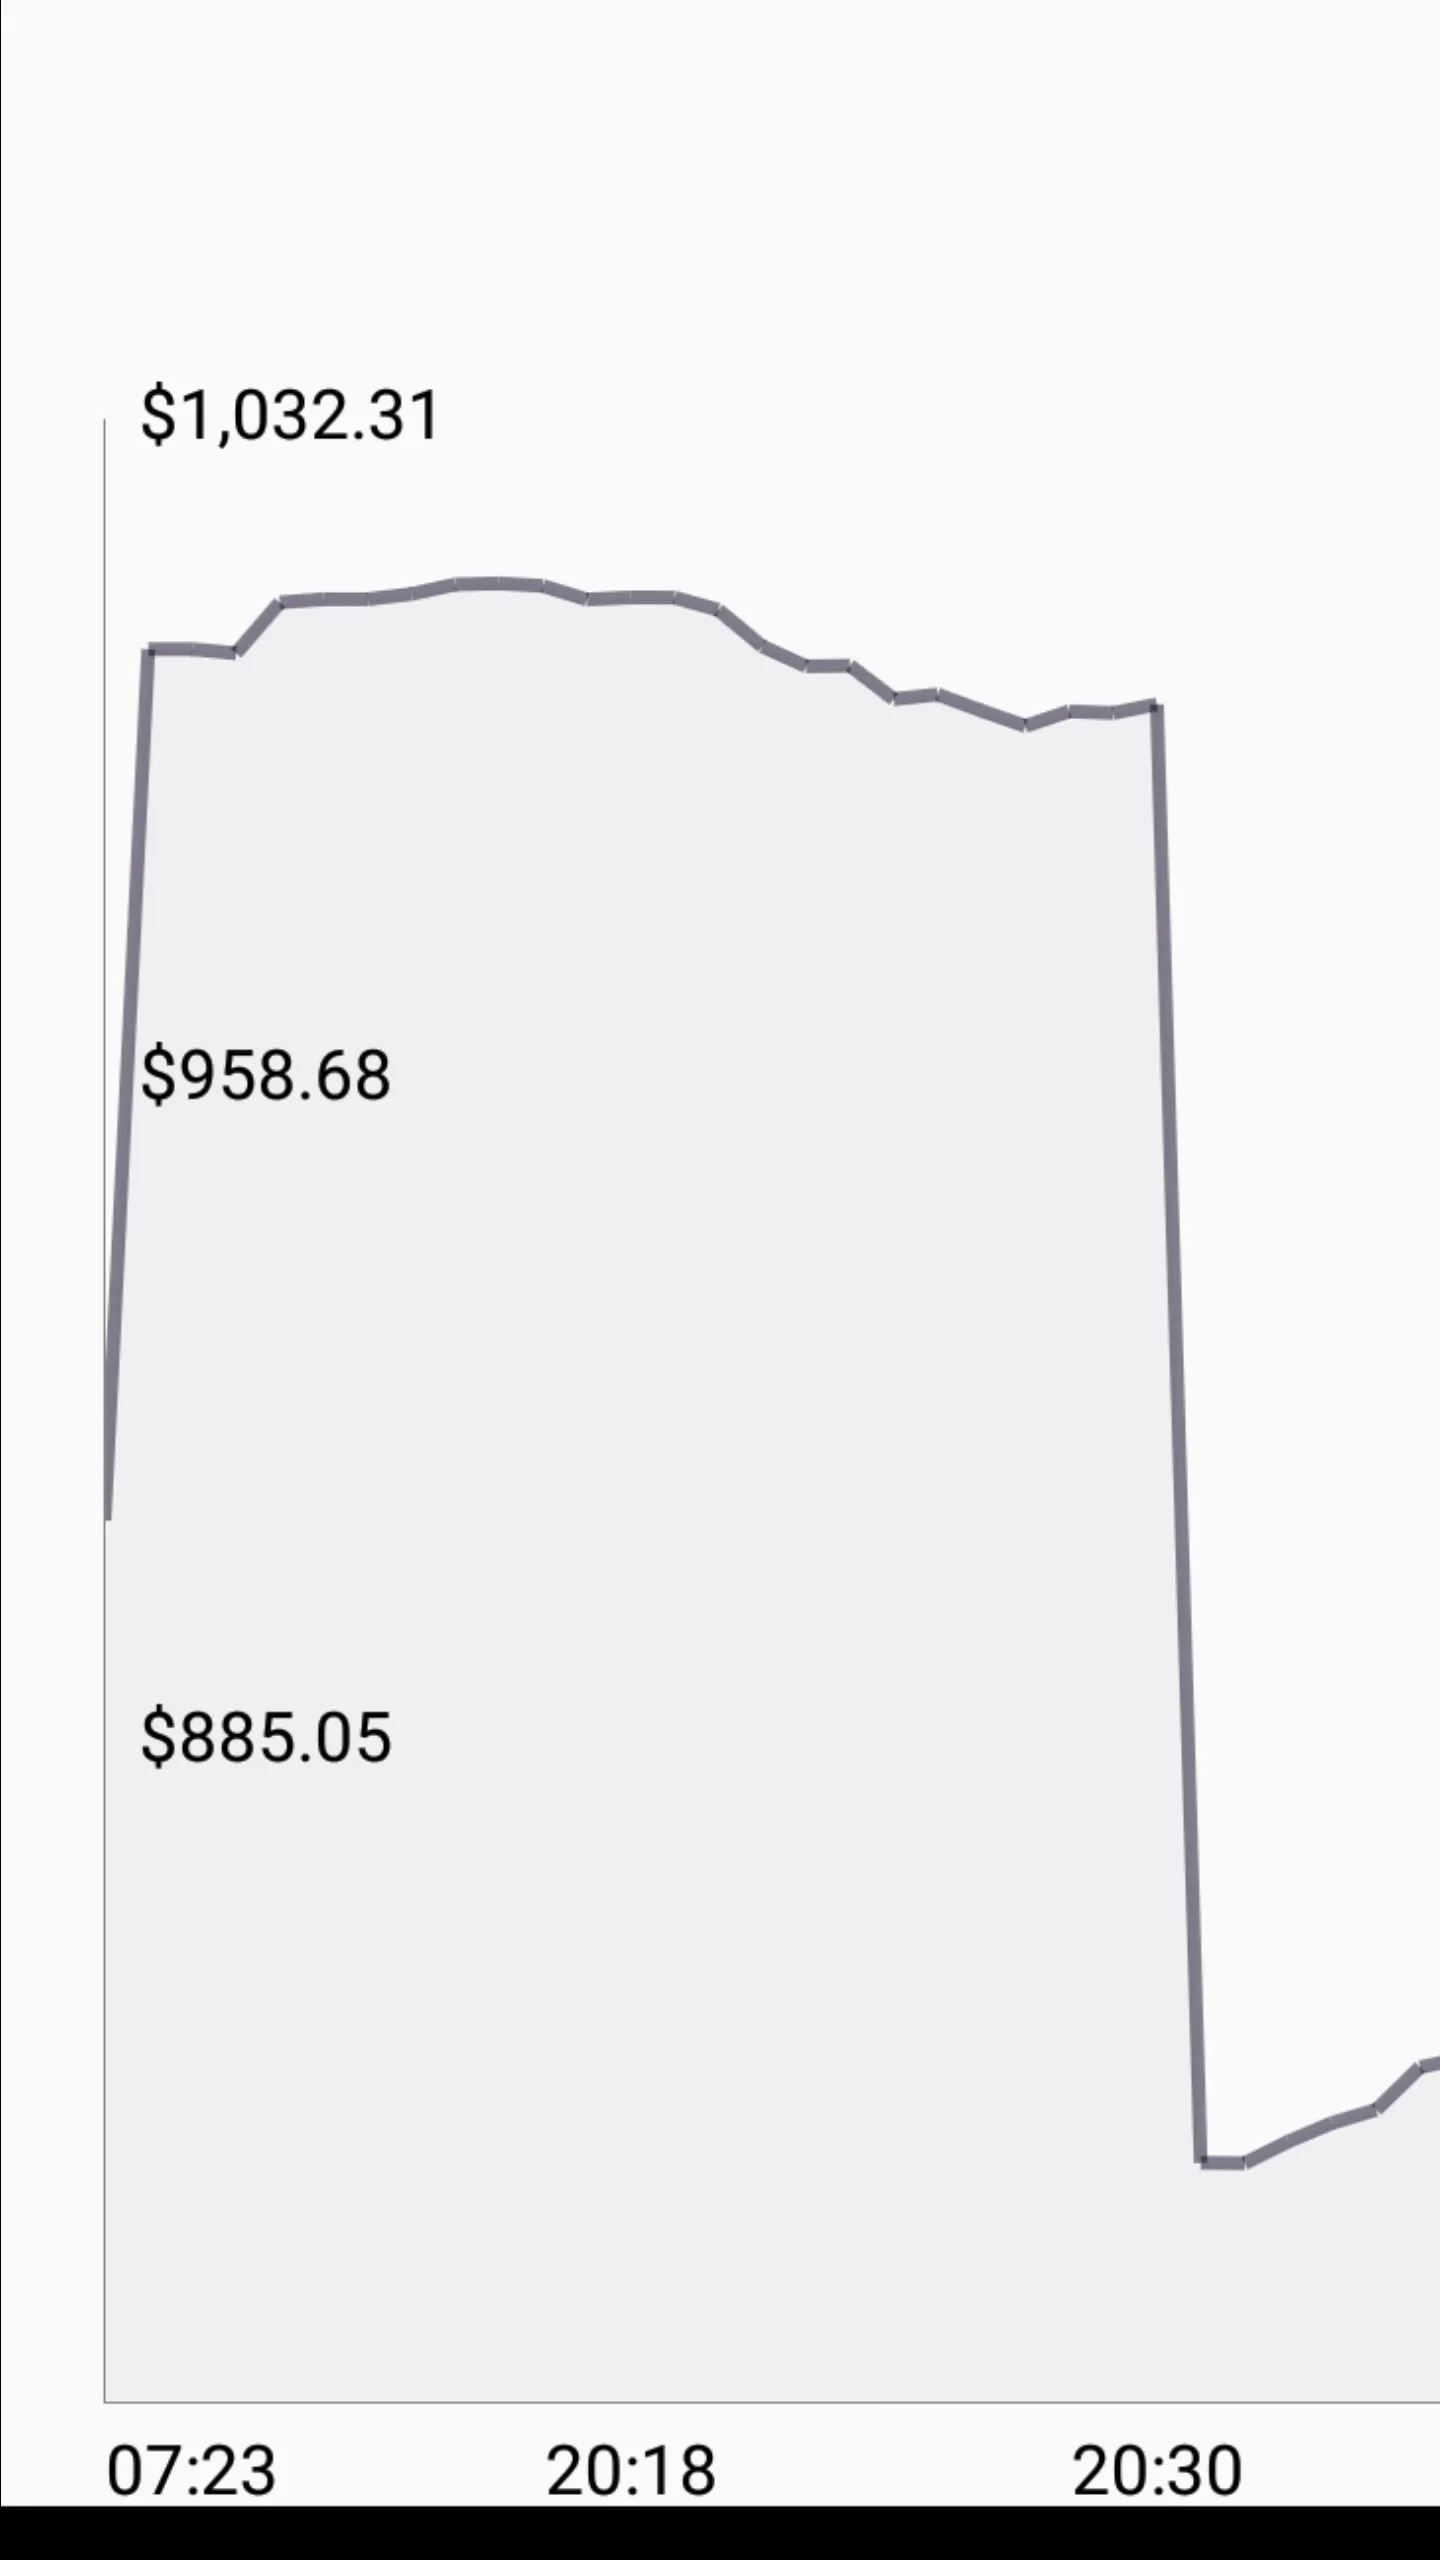
如何使我的Y轴标签升高并留有间隙,即从给定值开始,就像下面的图片一样?如果我尝试使用偏移量,它会使我的Y轴标签值与Y轴数据绘图不正确。
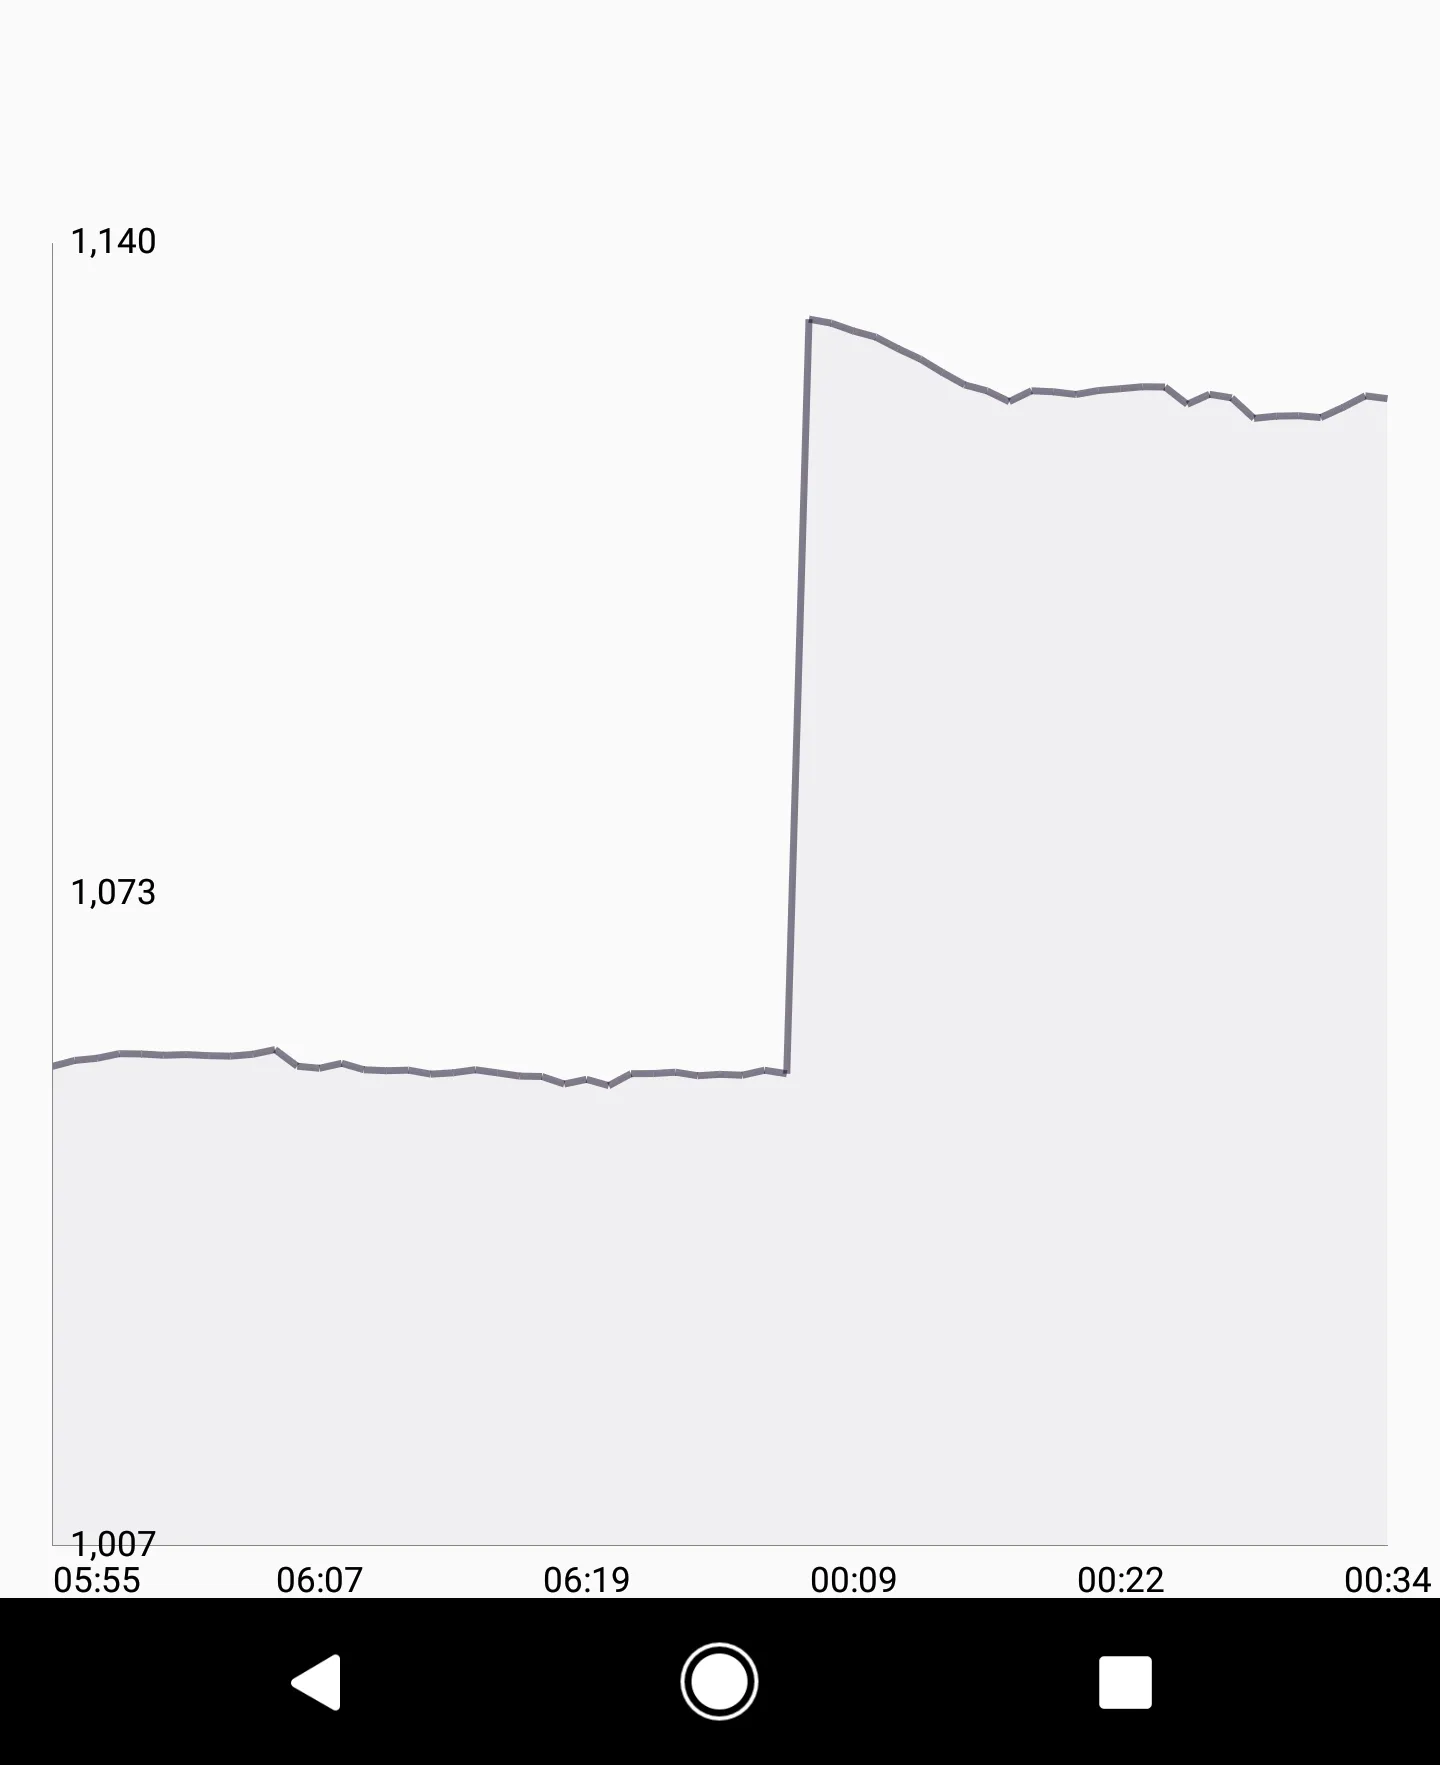
a stock price line chart with the YAxis labels starting from $412.66

这是我的目前的代码:

  public void setChartProperties() {
        YAxis rightAxis = chart.getAxisRight();
        YAxis leftAxis = chart.getAxisLeft();
        XAxis xAxis = chart.getXAxis();
        chart.getLegend().setEnabled(false);
        chart.getDescription().setEnabled(false);
        chart.setDrawBorders(false);
        chart.setPinchZoom(false);
        chart.setAutoScaleMinMaxEnabled(true);
        chart.setExtraOffsets(0, 0, 0, 0);
        xAxis.setLabelCount(6, true);
        xAxis.setGranularity(1f);
        xAxis.setDrawGridLines(false);
        xAxis.setPosition(XAxisPosition.BOTTOM);
        xAxis.setAvoidFirstLastClipping(true);
        leftAxis.setPosition(YAxisLabelPosition.INSIDE_CHART);
        leftAxis.setDrawLabels(true);
        leftAxis.setSpaceBottom(60);
        leftAxis.setDrawGridLines(true);
        leftAxis.setLabelCount(3, true);
        leftAxis.setCenterAxisLabels(true);
        leftAxis.setDrawGridLines(false);
        rightAxis.setEnabled(false);
        xAxis.setAvoidFirstLastClipping(true);
        dataSet.setColor(R.color.graphLineColor);
    }

这是我的图表的屏幕截图。

a chart with the YAxis labels starting from the correct value but with incorrect yValues


到目前为止有任何代码吗? - tar
已添加代码。谢谢! - Drew Szurko
1
你的意思是只想在yValues超过某个水平时显示标签?所以不是显示所有标签,对吗? - David Rawson
谢谢回复。我想要复制上面的蓝色图片和下面的内容。我使用了leftAxis.setSpaceBottom(60);让我的Y轴数据从底部开始60f,但是我还没有像上面那样复制3个标签。我也尝试了leftAxis.setLabelCount(3, true);,但是库决定了标签的间距和值(就像我上面的图片)。 - Drew Szurko
1个回答

2
通过实施 IAxisValueFormatter,我可以保留所有值并仅修改标签来实现这一目标。
public class MyValueFormatter implements IAxisValueFormatter {

    private final float cutoff;
    private final DecimalFormat format;

    public MyValueFormatter(float cutoff) {
        this.cutoff = cutoff;
        this.format = new DecimalFormat("###,###,###,##0.00");
    }

    @Override
    public String getFormattedValue(float value, AxisBase axis) {
        if (value < cutoff) {
            return "";
        }

        return "$" + format.format(value);
    }
}

然后我使用以下方式消耗它:

leftAxis.setValueFormatter(new MyValueFormatter(yMin));

其中yMin已经在之前定义:

private float yMin = 0; 

然后将图表的最小yValue分配给了传入的值。

根据OP的要求,具有从最小yValue开始的YAxis标签的图表


网页内容由stack overflow 提供, 点击上面的
可以查看英文原文,
原文链接