MPAndroidChart如何实现Y轴标签内部对齐并占据整个宽度?

4
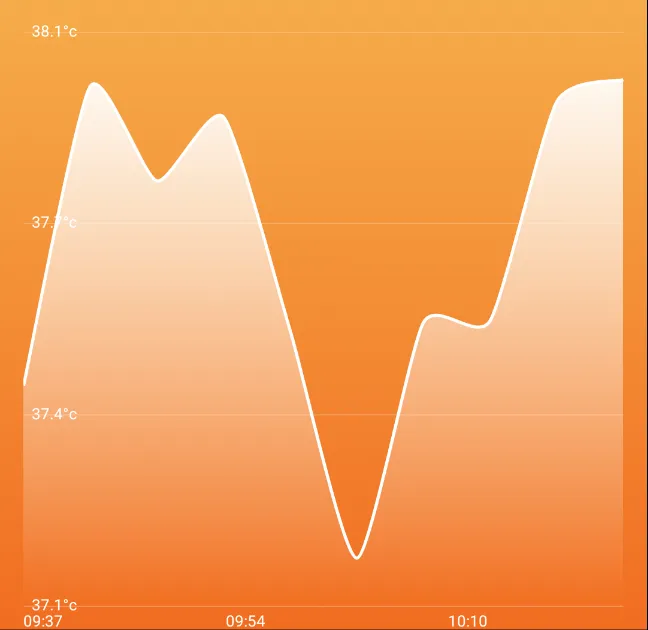
我遇到了设置图表全宽的问题;希望Y轴在x坐标0处,图形的右侧为全宽。
在设置图表时,我执行以下操作:
    setDrawGridBackground(false);
    setDrawBorders(false);
    getLegend().setEnabled(false);
    setAutoScaleMinMaxEnabled(true);
    setTouchEnabled(true);
    setDragEnabled(true);
    setScaleEnabled(true);
    setPinchZoom(true);
    setDoubleTapToZoomEnabled(false);
    setBackgroundColor(Color.TRANSPARENT);
    getAxisRight().setEnabled(false);
    getDescription().setEnabled(false);

    final YAxis yAxis = getAxisLeft();
    yAxis.setLabelCount(4,true);
    yAxis.setPosition(YAxis.YAxisLabelPosition.INSIDE_CHART);
    yAxis.setValueFormatter(new TemperatureValueFormatter());
    yAxis.setTextColor(Color.WHITE);
    yAxis.setGridColor(Color.argb(102,255,255,255));
    yAxis.setAxisLineColor(Color.TRANSPARENT);

    final XAxis xAxis = getXAxis();
    xAxis.setDrawLimitLinesBehindData(true);
    xAxis.setPosition(XAxis.XAxisPosition.BOTTOM);
    xAxis.setTextColor(Color.WHITE);
    xAxis.disableGridDashedLine();
    xAxis.setDrawGridLines(false);
    xAxis.setGridColor(Color.argb(204,255,255,255));
    xAxis.setAxisLineColor(Color.TRANSPARENT);
    xAxis.setValueFormatter(new TimestampValueFormatter());
    xAxis.setLabelCount(4);
    xAxis.setAvoidFirstLastClipping(true);
    xAxis.setSpaceMin(10f);

在添加初始数据或使用动态数据更新后,我调用以下内容:

invalidate();
fitScreen();

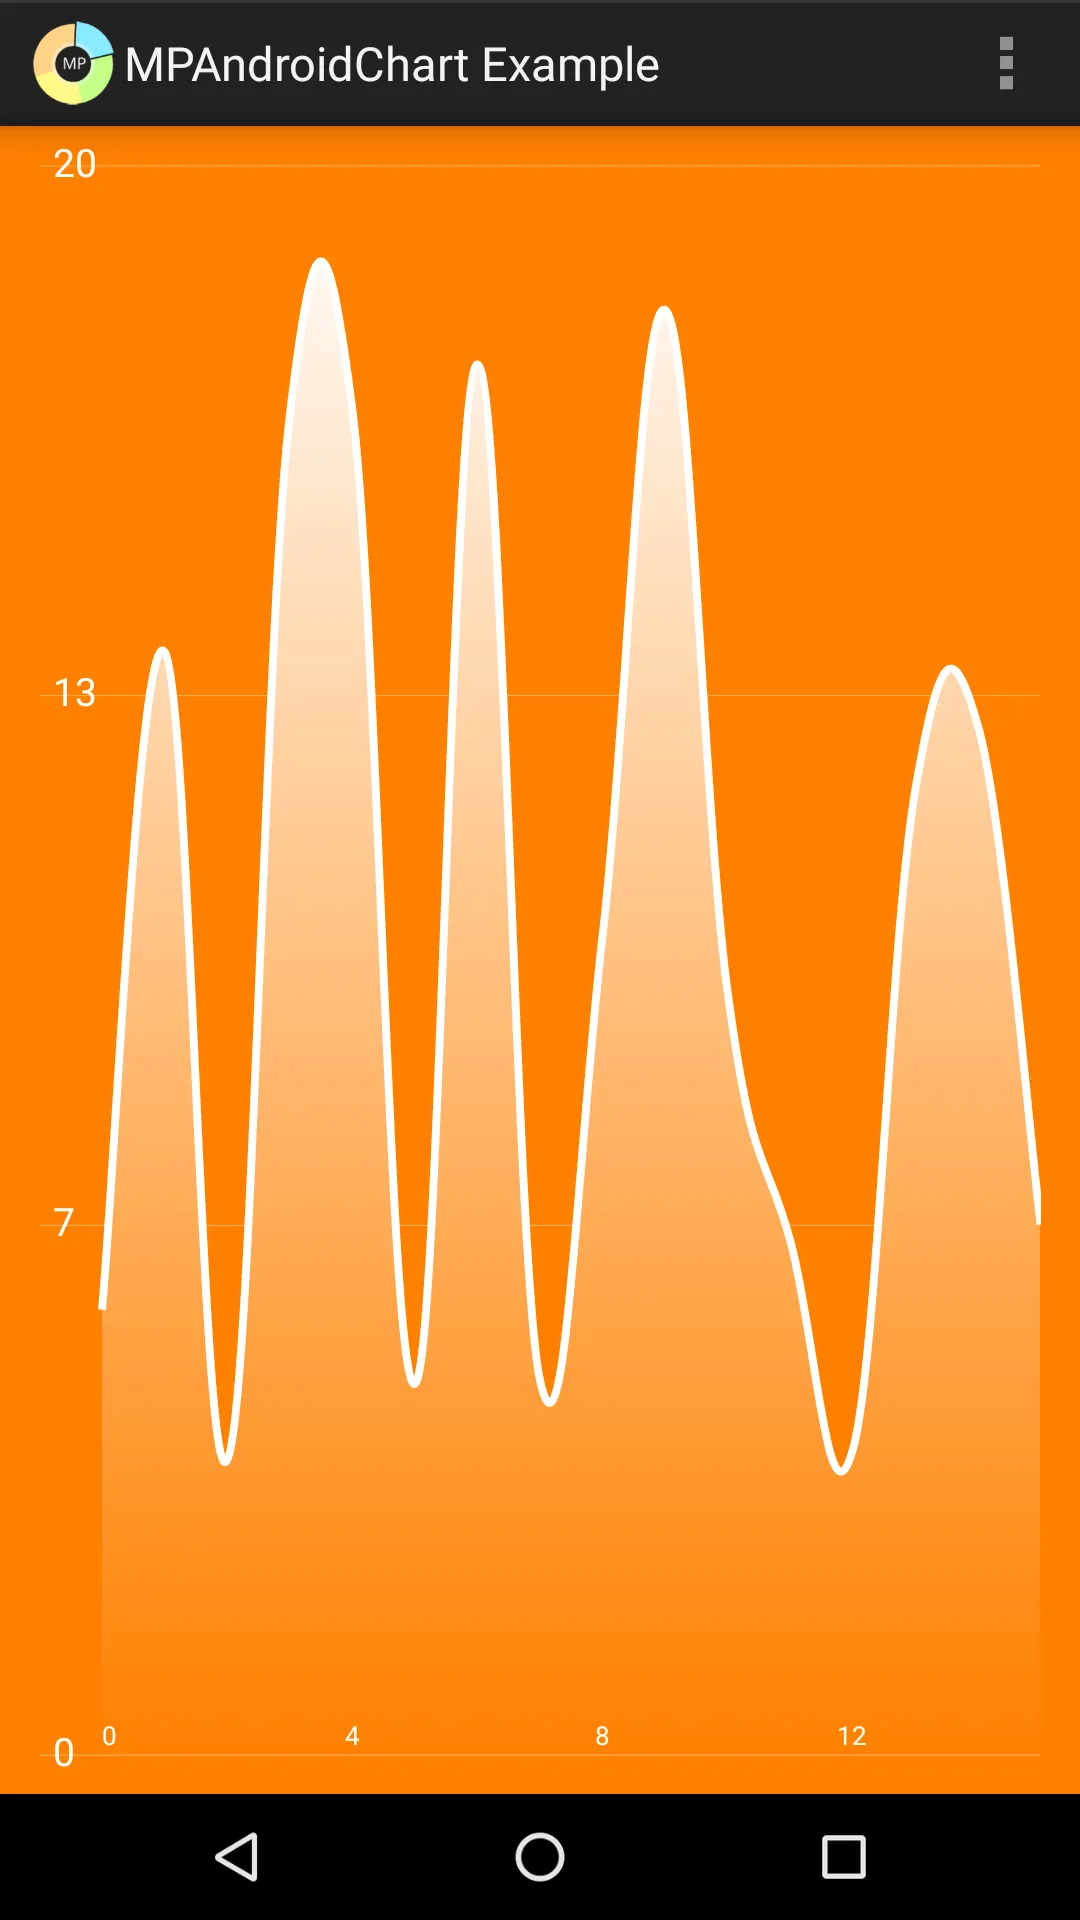
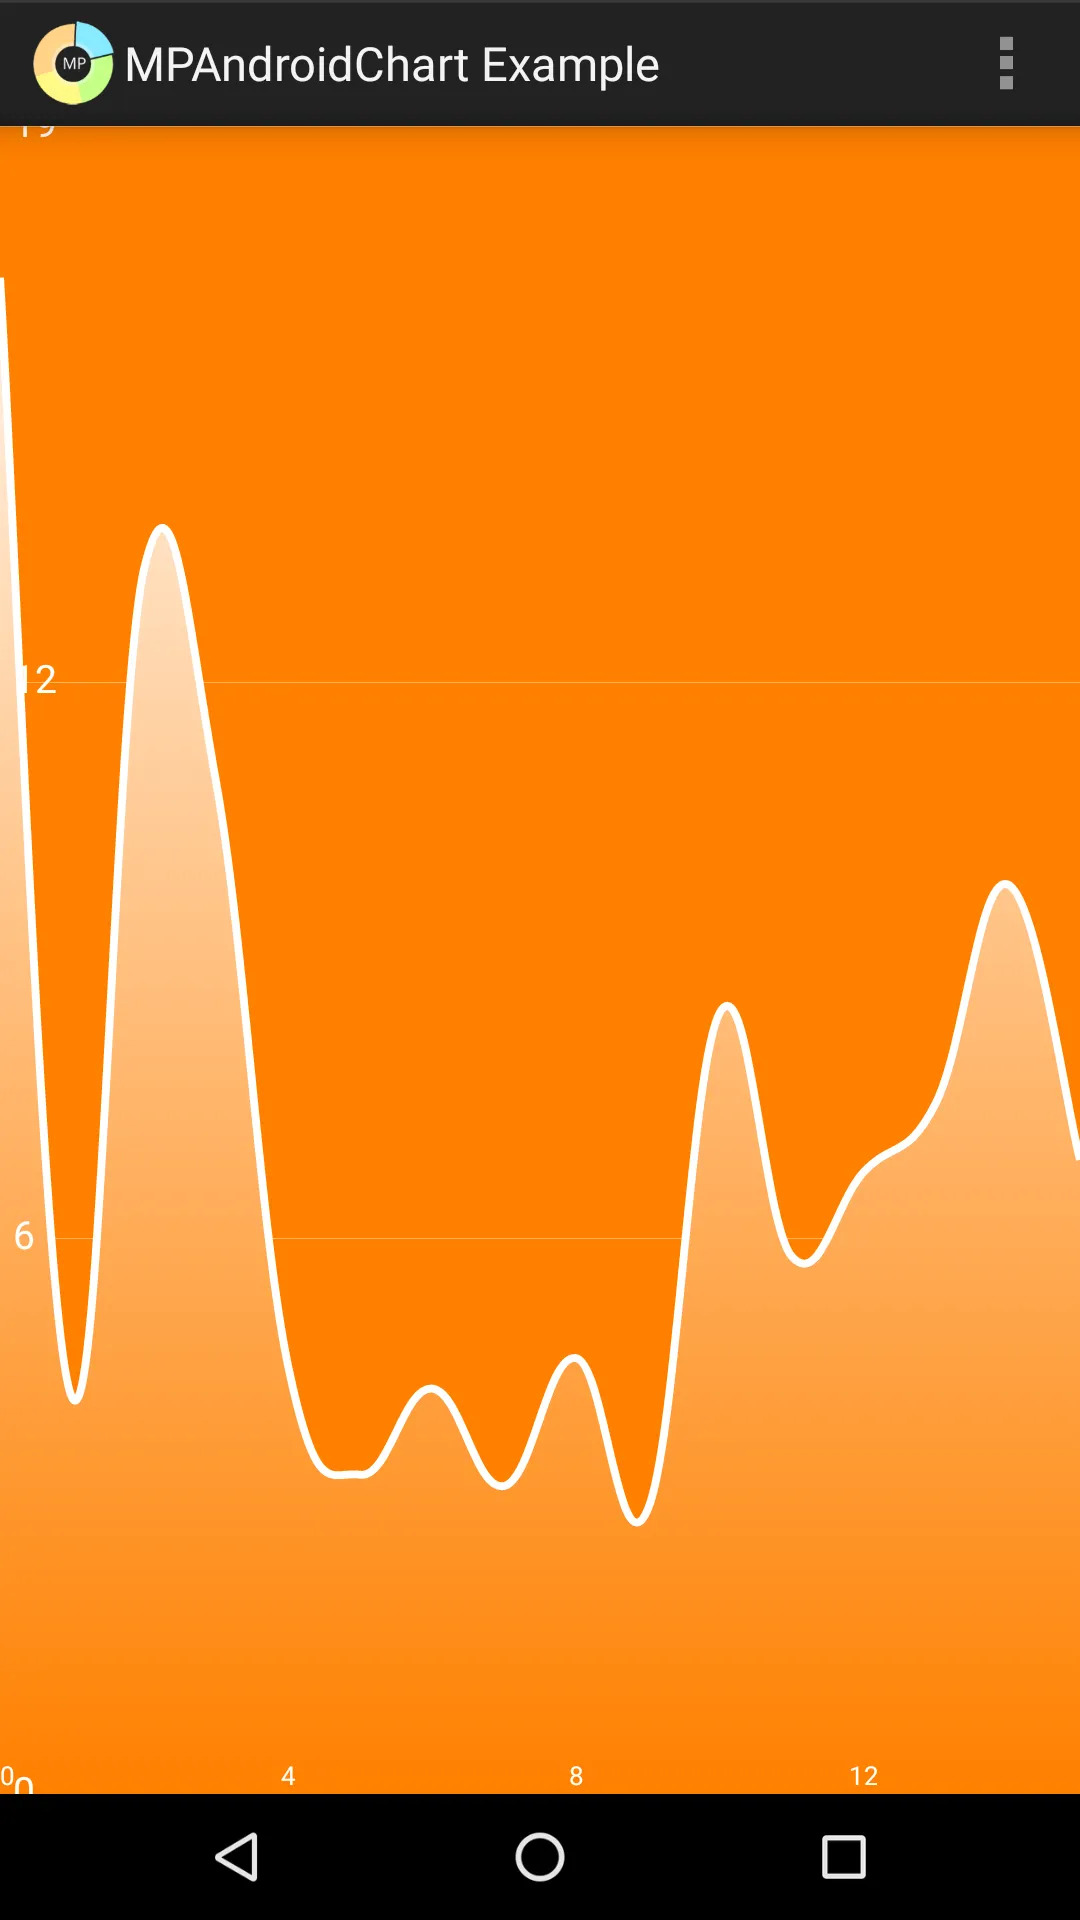
发生的情况是我的视图的y轴和左侧之间以及右侧边缘和右侧之间仍然存在边距。这个边距需要消失。
我尝试使用setExtraOffsets,但不幸的是它似乎限制在我看到的边距范围内,因为我尝试设置负值,但没有成功。
没有在任何父级或图表本身上设置填充或边距。当将Y轴标签位置更改为外部时,它们似乎使用视图的边缘,并且与将它们定位在内部时相同的边距不受约束。
我在这里做错了什么?
编辑截图

Current outcome


1
在你的Oncreate()方法中使用以下代码:chart.setViewPortOffsets(0f, 0f, 0f, 0f); xAxis.setEnabled(true); yAxis.setEnabled(true);如果这些命令不起作用,请展示你的XML布局。 - Samarth Kejriwal
1个回答

7

使用 MPAndroidChart 3.0.1

通过从您在问题中提供的代码中删除此行,我能够实现您想要的效果:

   xAxis.setSpaceMin(10f); //DON'T NEED THIS!!

并添加以下代码:
    mChart.setViewPortOffsets(0f, 0f, 0f, 0f);
    float xMax = mChart.getData().getDataSetByIndex(0).getXMax();
    float xMin = 0;
    xAxis.setAxisMaximum(xMax);
    xAxis.setAxisMinimum(xMin);

之前:(请注意左xAxis线和第一个x值0之间的间距-这是不需要的)

具有左侧xAxis和第一个值0之间间距的折线图

之后:(请注意我们现在已经修复了这个问题,因此没有边距,第一项x值与屏幕左侧对齐,符合原始帖子的要求)

符合OP规格的边距齐平的折线图

如果您有其他UI要求,并未在问题中提及,因此本答案似乎已解决您的问题。 您可能还想考虑:

xAxis.setPosition(XAxis.XAxisPosition.BOTTOM_INSIDE); //changed to match your screenshot

一个完整的概念验证:
import android.graphics.Color;
import android.graphics.drawable.Drawable;
import android.os.Bundle;
import android.support.v4.content.ContextCompat;
import android.view.Menu;
import android.view.WindowManager;

import com.github.mikephil.charting.charts.LineChart;
import com.github.mikephil.charting.components.XAxis;
import com.github.mikephil.charting.components.YAxis;
import com.github.mikephil.charting.data.Entry;
import com.github.mikephil.charting.data.LineData;
import com.github.mikephil.charting.data.LineDataSet;
import com.github.mikephil.charting.formatter.DefaultAxisValueFormatter;
import com.github.mikephil.charting.interfaces.datasets.ILineDataSet;
import com.github.mikephil.charting.utils.Utils;

import java.util.ArrayList;

public class LineChartActivity5 extends Activity {

    private LineChart mChart;

    @Override
    protected void onCreate(Bundle savedInstanceState) {
        super.onCreate(savedInstanceState);

        getWindow().setFlags(WindowManager.LayoutParams.FLAG_FULLSCREEN,
                WindowManager.LayoutParams.FLAG_FULLSCREEN);
        setContentView(R.layout.activity_linechart);

        mChart = (LineChart) findViewById(R.id.chart1);

        mChart.setDrawGridBackground(false);
        mChart.setDrawBorders(false);
        mChart.getLegend().setEnabled(false);
        mChart.setAutoScaleMinMaxEnabled(true);
        mChart.setTouchEnabled(true);
        mChart.setDragEnabled(true);
        mChart.setScaleEnabled(true);
        mChart.setPinchZoom(true);
        mChart.setDoubleTapToZoomEnabled(false);
        mChart.setBackgroundColor(Color.parseColor("#FF8000"));
        mChart.getAxisRight().setEnabled(false);
        mChart.getDescription().setEnabled(false);

        final YAxis yAxis = mChart.getAxisLeft();
        yAxis.setLabelCount(4,true);
        yAxis.setPosition(YAxis.YAxisLabelPosition.INSIDE_CHART);
        yAxis.setValueFormatter(new DefaultAxisValueFormatter(2));
        yAxis.setTextColor(Color.WHITE);
        yAxis.setTextSize(15f); //not in your original but added
        yAxis.setGridColor(Color.argb(102,255,255,255));
        yAxis.setAxisLineColor(Color.TRANSPARENT);
        yAxis.setAxisMinimum(0); //not in your original but added

        final XAxis xAxis = mChart.getXAxis();
        xAxis.setDrawLimitLinesBehindData(true);
        xAxis.setPosition(XAxis.XAxisPosition.BOTTOM_INSIDE); //changed to match your spec
        xAxis.setTextColor(Color.WHITE);
        xAxis.disableGridDashedLine();
        xAxis.setDrawGridLines(false);
        xAxis.setGridColor(Color.argb(204,255,255,255));

        xAxis.setAxisLineColor(Color.TRANSPARENT);
        xAxis.setValueFormatter(new DefaultAxisValueFormatter(2)); //not in your original but added
        //xAxis.setValueFormatter(new TimestampValueFormatter());
        xAxis.setLabelCount(4);
        xAxis.setAvoidFirstLastClipping(true);
        //xAxis.setSpaceMin(10f); //DON'T NEED THIS!!

        setData(16, 15);

        mChart.setViewPortOffsets(0f, 0f, 0f, 0f);
        float xMax = mChart.getData().getDataSetByIndex(0).getXMax();
        float xMin = 0;
        xAxis.setAxisMaximum(xMax);
        xAxis.setAxisMinimum(xMin);
    }

    private void setData(int count, float range) {

        ArrayList<Entry> values = new ArrayList<Entry>();

        for (int i = 0; i < count; i++) {

            float val = (float) (Math.random() * range) + 3;
            values.add(new Entry(i, val));
        }

        LineDataSet set1;

        if (mChart.getData() != null &&
                mChart.getData().getDataSetCount() > 0) {
            set1 = (LineDataSet)mChart.getData().getDataSetByIndex(0);
            set1.setValues(values);
            mChart.getData().notifyDataChanged();
            mChart.notifyDataSetChanged();
        } else {
            set1 = new LineDataSet(values, "DataSet 1");
            set1.setColor(Color.WHITE);
            set1.setCircleColor(Color.BLACK);
            set1.setLineWidth(3f);
            set1.setDrawCircles(false);
            set1.setMode(LineDataSet.Mode.CUBIC_BEZIER);

            set1.setValueTextSize(9f);
            set1.setDrawValues(false);
            set1.setDrawFilled(true);
            set1.setFormLineWidth(1f);
            set1.setFormSize(15.f);

            if (Utils.getSDKInt() >= 18) {
                // fill drawable only supported on api level 18 and above
                Drawable drawable = ContextCompat.getDrawable(this, R.drawable.fade_orange);
                set1.setFillDrawable(drawable);
            }
            else {
                set1.setFillColor(Color.BLACK);
            }

            ArrayList<ILineDataSet> dataSets = new ArrayList<ILineDataSet>();
            dataSets.add(set1); // add the datasets

            // create a data object with the datasets
            LineData data = new LineData(dataSets);

            // set data
            mChart.setData(data);
        }
    }
    @Override
    public boolean onCreateOptionsMenu(Menu menu) {
        getMenuInflater().inflate(R.menu.line, menu);
        return true;
    }
}

1
感谢您详细的回答。您的解释很有帮助,主要修复是设置视口偏移量。经过一些尝试,调用此方法的时间也很重要。 - StuStirling
它对于API>=24有效,但出于某些原因,setViewPortOffsets在API<24上不起作用。 - nnyerges
如果您的起始值不是0呢? - AtomicallyBeyond

网页内容由stack overflow 提供, 点击上面的
可以查看英文原文,
原文链接