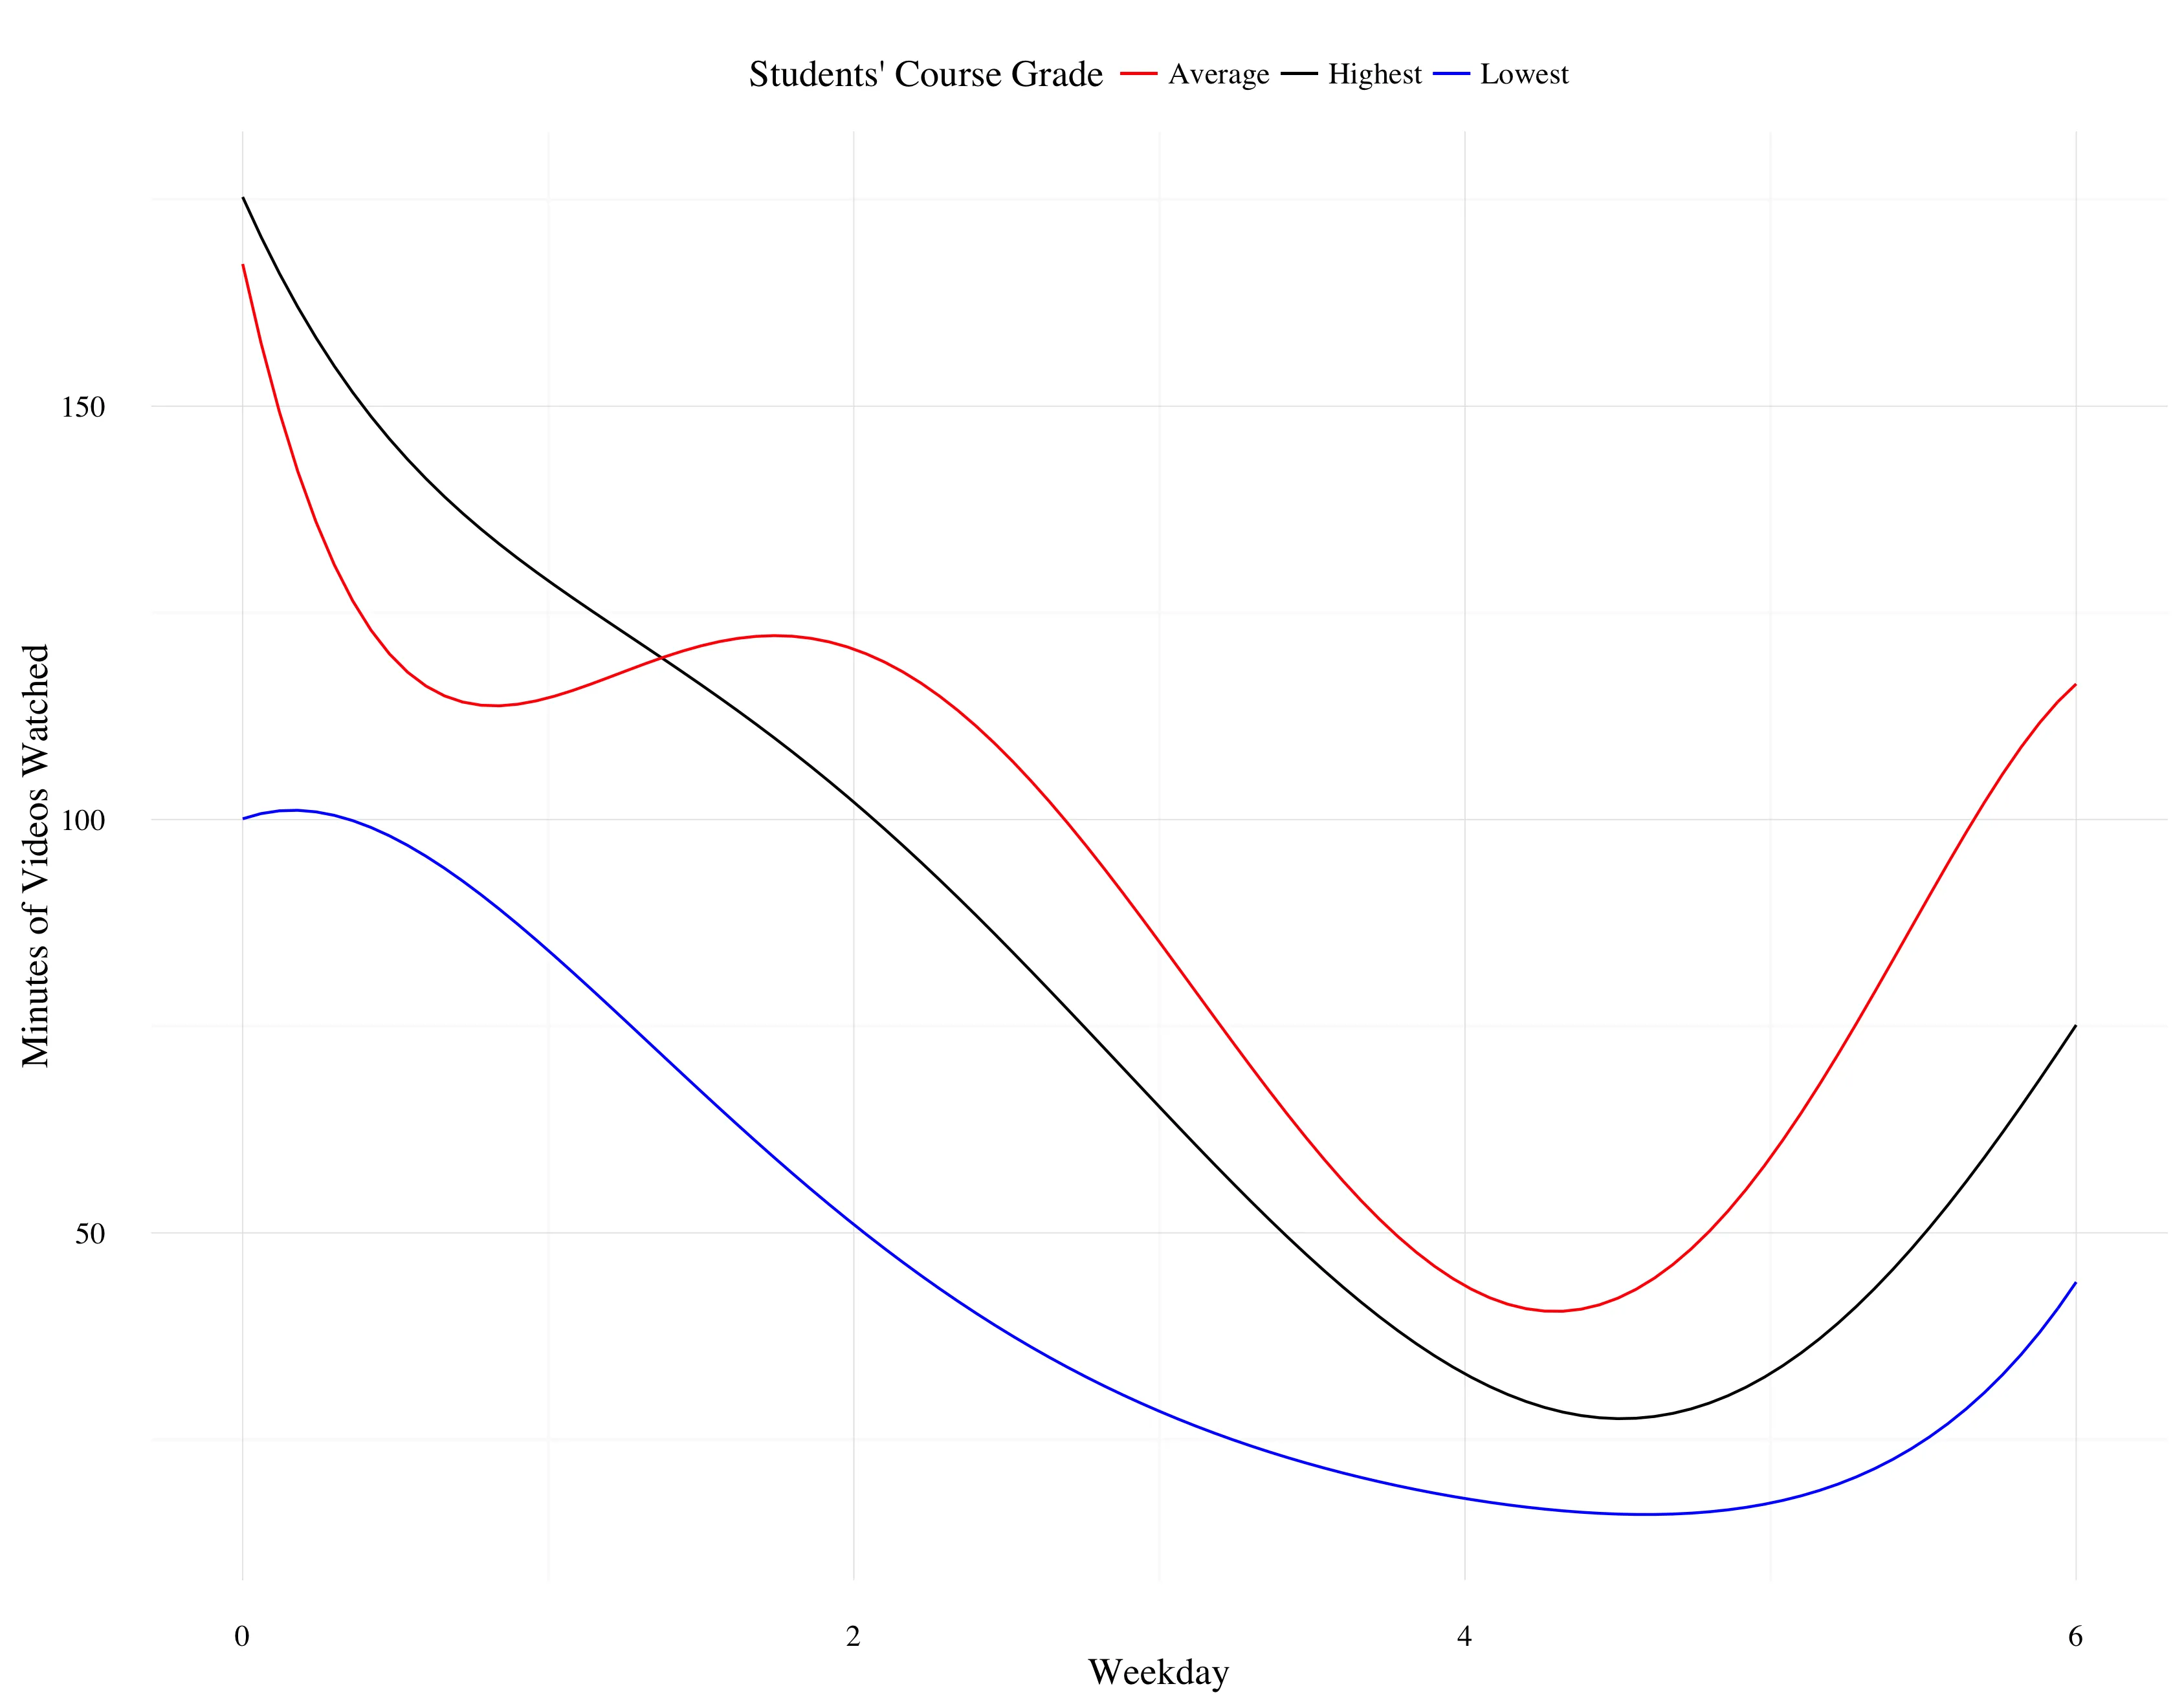
我试图在具有连续比例尺的ggplot2图中添加离散标签。虽然有许多问题使用stat_function(即关于绘制多个函数的),也有许多关于如何使用不同比例尺的问题,但我很难理解如何在这种特定情况下更改比例尺。
这是绘图:
myfun1 <- function(x) (13.076-96.543)*x + (-44.056 +102.057)*x^2 + (17.856 -42.996)*x^3 + (-2.996  + 7.444)*x^4 + (0.190 -0.450)*x^5 + 100.088 + 75.215 # average vs. lowest
myfun2 <- function(x) 13.076*x -44.056*x^2 + 17.856*x^3 -2.996*x^4 + 0.190*x^5 + 100.088 # lowest
myfun3 <- function(x) (13.076-183.093)*x + (-44.056 +229.447)*x^2 + (17.856 -99.353)*x^3 + (-2.996  + 17.517)*x^4 + (0.190 -1.080)*x^5 + 100.088 + 67.115 # highest vs. lowest

df <- data.frame(x = c(0, 6), y = c(0, 6))

myplot_weekday <- ggplot(data = df, aes(x = x, y = y)) +
  stat_function(fun = myfun3, aes(color = "Highest")) +
  stat_function(fun = myfun2, aes(color = "Lowest")) +
  stat_function(fun = myfun1, aes(color = "Average")) +
  theme_minimal() +
  scale_colour_manual("Students' Course Grade", values = c("red", "black", "blue")) +
  theme(legend.position = "top") +
  theme(text=element_text(size= 14, family= "Times")) +
  ylab("Minutes of Videos Watched") +
  xlab("Weekday")
我想在x轴上添加“星期日”、“星期一”、“星期二”、“星期三”、“星期四”、“星期五”和“星期六”的标签,而不是连续的标签(0、2、4和6),但我感觉我做错了。

'x'的比例已经存在。添加另一个'x'的比例,将替换现有的比例。我忽略了它,但似乎当我保存图时,原始(即0、2、4、6)比例被保存。有什么提示可以保存新的(标记的)比例吗? - Joshua Rosenbergxlab(),最好将name =“Weekday”添加到scale_x_continuous中并放弃xlab。至于不保存,请确保重新分配绘图对象。如果只执行my_plot_weekday + scale_x_cont...,它将显示而不修改现有的绘图对象。您需要my_plot_weekday <- my_plot_weekday +...(或将其添加到原始定义中并重新运行分配)。 - Gregor Thomas