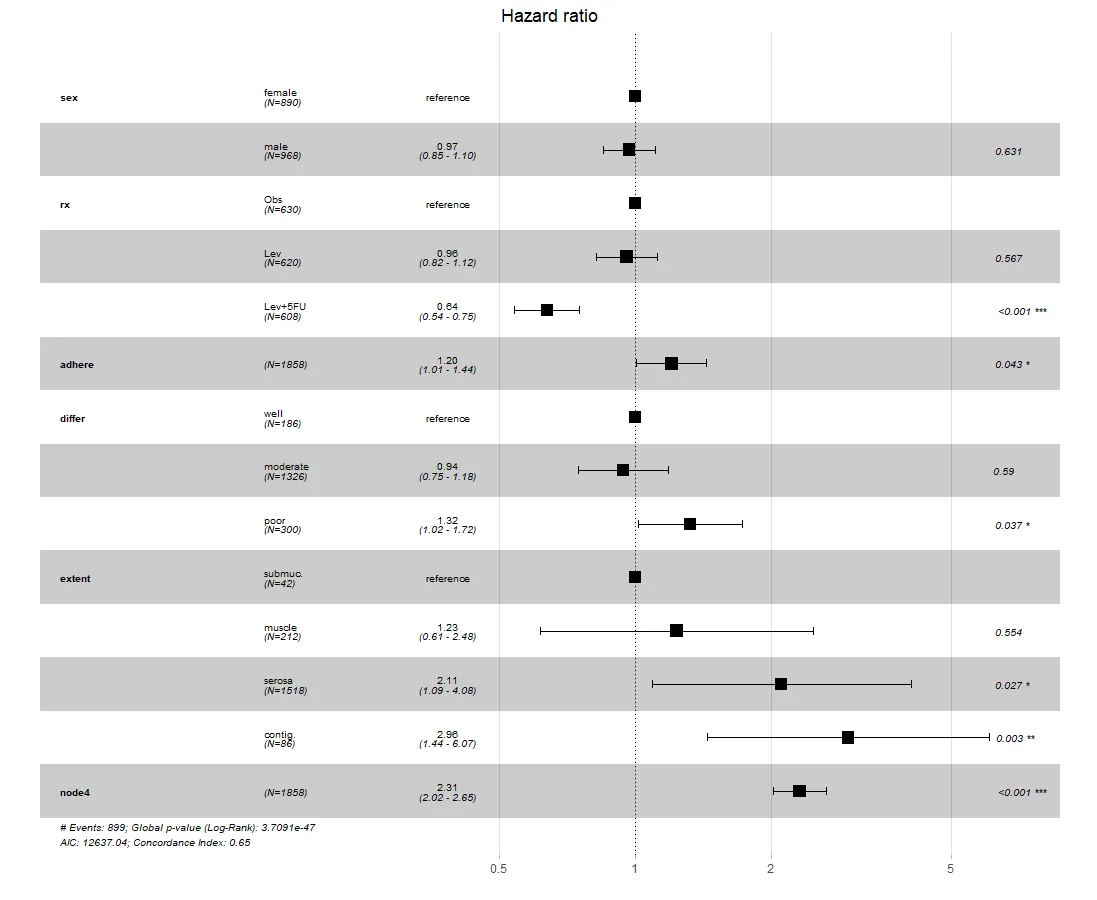
我了解到所需的森林图是在模型公式中简单跳过分层的RX变量。如果是这样,我们可以在内部插入一个if语句,忽略与数据列名称不完全对应的公式部分(例如,"strata(rx)"不是列名)。
方法1
如果你足够熟悉R以修改函数,请运行trace(ggforest, edit = TRUE)并在弹出窗口中用以下版本替换allTerms <- lapply(...)(大约在第10-25行附近):
allTerms <- lapply(seq_along(terms), function(i) {
  var <- names(terms)[i]
  if(var %in% colnames(data)) {
    if (terms[i] %in% c("factor", "character")) {
      adf <- as.data.frame(table(data[, var]))
      cbind(var = var, adf, pos = 1:nrow(adf))
    }
    else if (terms[i] == "numeric") {
      data.frame(var = var, Var1 = "", Freq = nrow(data),
                 pos = 1)
    }
    else {
      vars = grep(paste0("^", var, "*."), coef$term,
                  value = TRUE)
      data.frame(var = vars, Var1 = "", Freq = nrow(data),
                 pos = seq_along(vars))
    }
  } else {
    message(var, "is not found in data columns, and will be skipped.")
  }

})
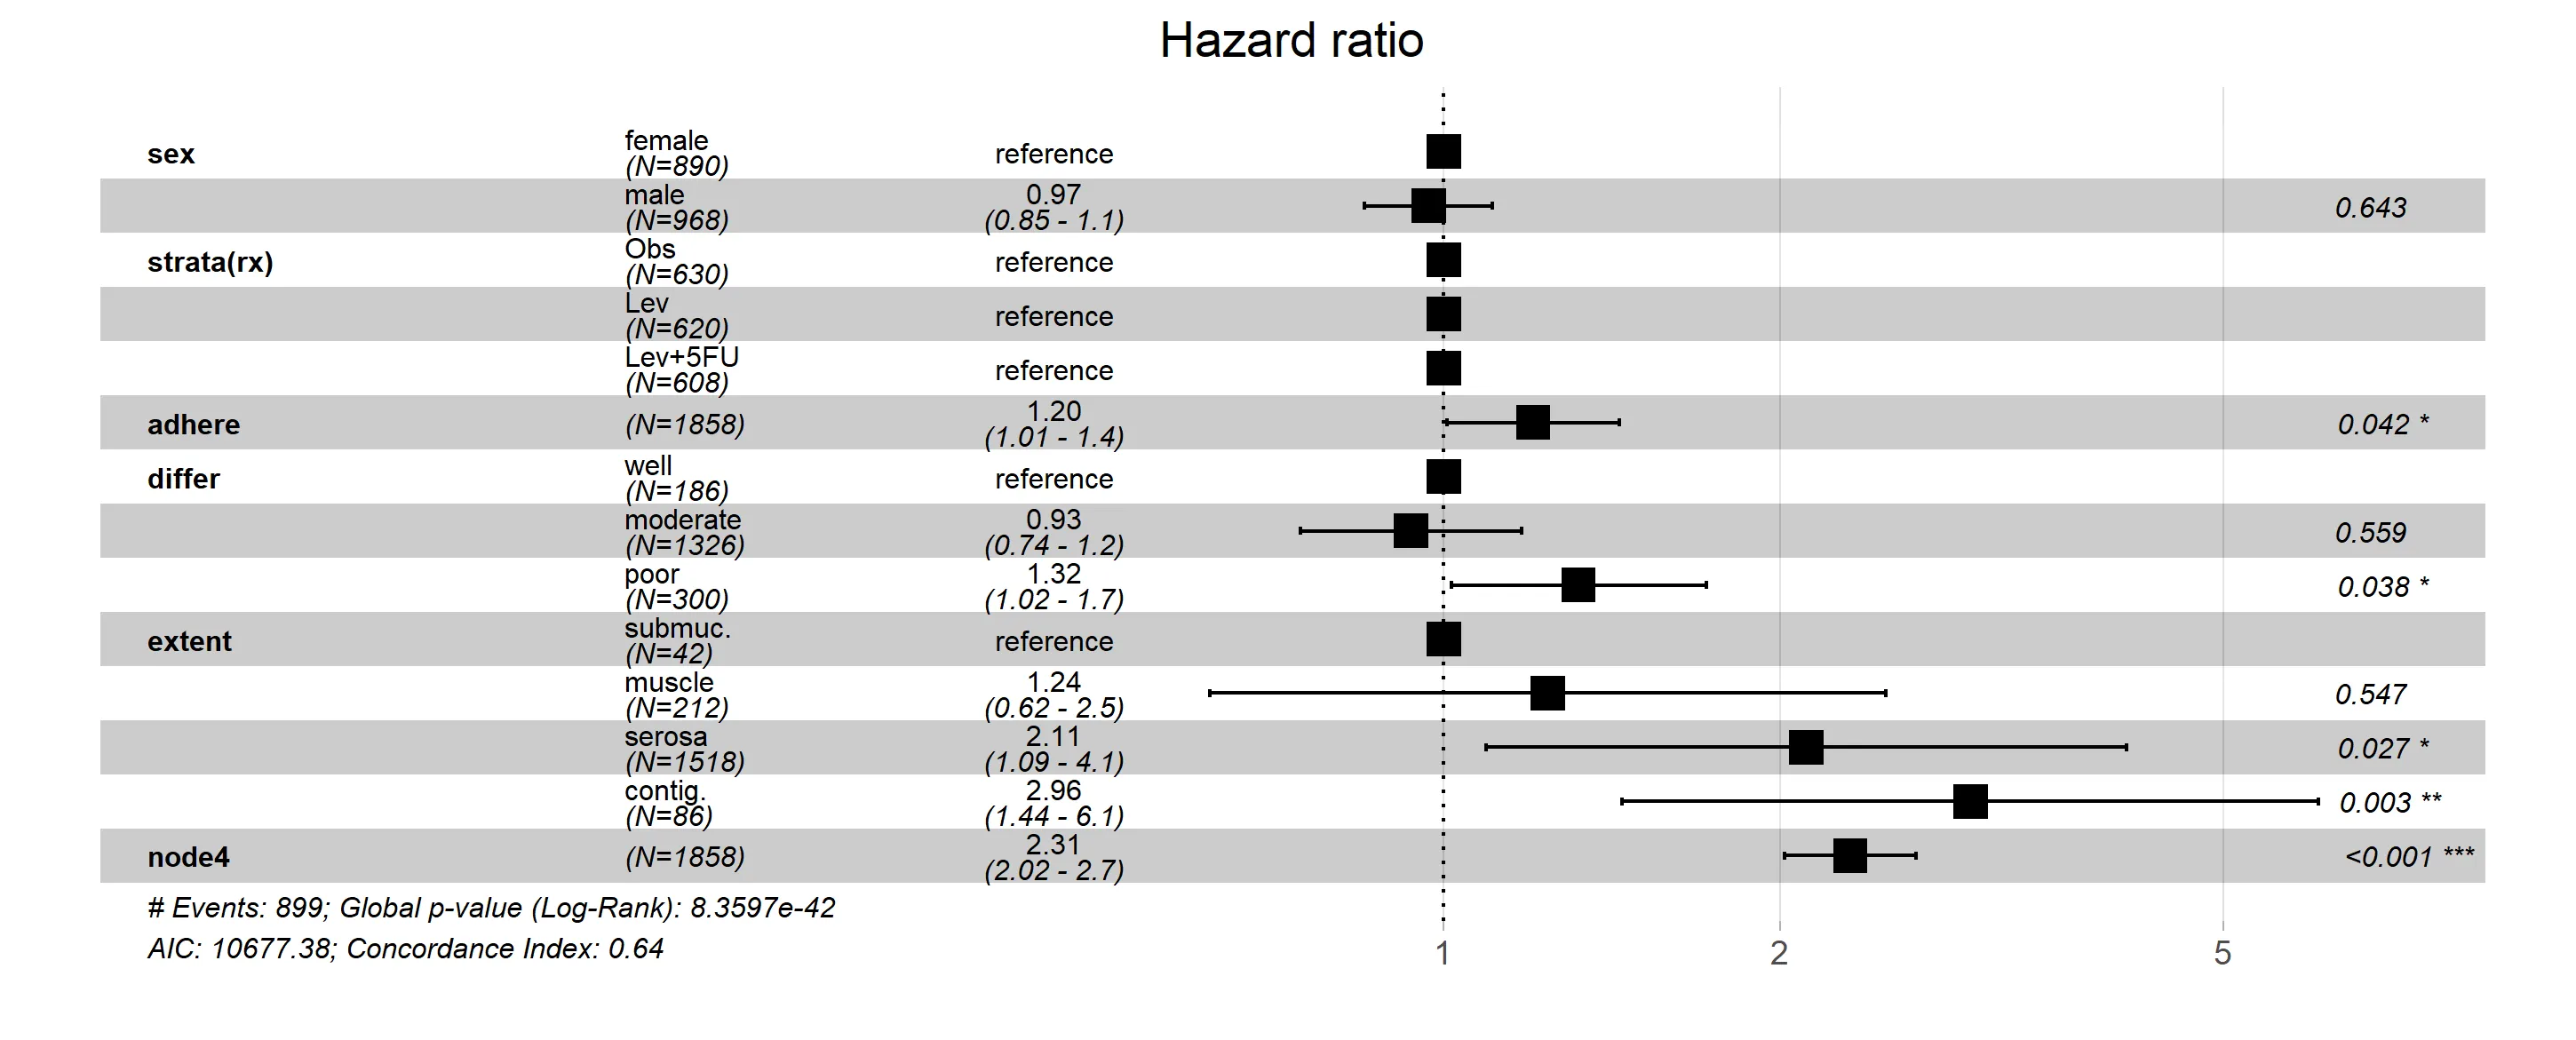
ggforest(stratamodel)

这种修改不会保留到后续的R会话中。如果您想在当前会话中撤消修改,只需运行untrace(ggforest)。
方法2
如果您希望永久修改函数以备将来使用/不想对库函数进行操作,请保存以下函数:
ggforest2 <- function (model, data = NULL, main = "Hazard ratio",
                       cpositions = c(0.02, 0.22, 0.4), fontsize = 0.7,
                       refLabel = "reference", noDigits = 2) {
  conf.high <- conf.low <- estimate <- NULL
  stopifnot(class(model) == "coxph")
  data <- survminer:::.get_data(model, data = data)
  terms <- attr(model$terms, "dataClasses")[-1]
  coef <- as.data.frame(broom::tidy(model))
  gmodel <- broom::glance(model)
  allTerms <- lapply(seq_along(terms), function(i) {
    var <- names(terms)[i]
    if(var %in% colnames(data)) {
      if (terms[i] %in% c("factor", "character")) {
        adf <- as.data.frame(table(data[, var]))
        cbind(var = var, adf, pos = 1:nrow(adf))
      }
      else if (terms[i] == "numeric") {
        data.frame(var = var, Var1 = "", Freq = nrow(data),
                   pos = 1)
      }
      else {
        vars = grep(paste0("^", var, "*."), coef$term,
                    value = TRUE)
        data.frame(var = vars, Var1 = "", Freq = nrow(data),
                   pos = seq_along(vars))
      }
    } else {
      message(var, "is not found in data columns, and will be skipped.")
    }
  })
  allTermsDF <- do.call(rbind, allTerms)
  colnames(allTermsDF) <- c("var", "level", "N",
                            "pos")
  inds <- apply(allTermsDF[, 1:2], 1, paste0, collapse = "")
  rownames(coef) <- gsub(coef$term, pattern = "`", replacement = "")
  toShow <- cbind(allTermsDF, coef[inds, ])[, c("var", "level", "N", "p.value",
                                                "estimate", "conf.low",
                                                "conf.high", "pos")]
  toShowExp <- toShow[, 5:7]
  toShowExp[is.na(toShowExp)] <- 0
  toShowExp <- format(exp(toShowExp), digits = noDigits)
  toShowExpClean <- data.frame(toShow, pvalue = signif(toShow[, 4], noDigits + 1),
                               toShowExp)
  toShowExpClean$stars <- paste0(round(toShowExpClean$p.value, noDigits + 1), " ",
                                 ifelse(toShowExpClean$p.value < 0.05, "*", ""),
                                 ifelse(toShowExpClean$p.value < 0.01, "*", ""),
                                 ifelse(toShowExpClean$p.value < 0.001, "*", ""))
  toShowExpClean$ci <- paste0("(", toShowExpClean[, "conf.low.1"],
                              " - ", toShowExpClean[, "conf.high.1"], ")")
  toShowExpClean$estimate.1[is.na(toShowExpClean$estimate)] = refLabel
  toShowExpClean$stars[which(toShowExpClean$p.value < 0.001)] = "<0.001 ***"
  toShowExpClean$stars[is.na(toShowExpClean$estimate)] = ""
  toShowExpClean$ci[is.na(toShowExpClean$estimate)] = ""
  toShowExpClean$estimate[is.na(toShowExpClean$estimate)] = 0
  toShowExpClean$var = as.character(toShowExpClean$var)
  toShowExpClean$var[duplicated(toShowExpClean$var)] = ""
  toShowExpClean$N <- paste0("(N=", toShowExpClean$N, ")")
  toShowExpClean <- toShowExpClean[nrow(toShowExpClean):1, ]
  rangeb <- range(toShowExpClean$conf.low, toShowExpClean$conf.high,
                  na.rm = TRUE)
  breaks <- axisTicks(rangeb/2, log = TRUE, nint = 7)
  rangeplot <- rangeb
  rangeplot[1] <- rangeplot[1] - diff(rangeb)
  rangeplot[2] <- rangeplot[2] + 0.15 * diff(rangeb)
  width <- diff(rangeplot)
  y_variable <- rangeplot[1] + cpositions[1] * width
  y_nlevel <- rangeplot[1] + cpositions[2] * width
  y_cistring <- rangeplot[1] + cpositions[3] * width
  y_stars <- rangeb[2]
  x_annotate <- seq_len(nrow(toShowExpClean))
  annot_size_mm <- fontsize *
    as.numeric(grid::convertX(unit(theme_get()$text$size, "pt"), "mm"))
  p <- ggplot(toShowExpClean,
              aes(seq_along(var), exp(estimate))) +
    geom_rect(aes(xmin = seq_along(var) - 0.5,
                  xmax = seq_along(var) + 0.5,
                  ymin = exp(rangeplot[1]),
                  ymax = exp(rangeplot[2]),
                  fill = ordered(seq_along(var)%%2 + 1))) +
    scale_fill_manual(values = c("#FFFFFF33",  "#00000033"), guide = "none") +
    geom_point(pch = 15, size = 4) +
    geom_errorbar(aes(ymin = exp(conf.low), ymax = exp(conf.high)),
                  width = 0.15) +
    geom_hline(yintercept = 1, linetype = 3) +
    coord_flip(ylim = exp(rangeplot)) +
    ggtitle(main) +
    scale_y_log10(name = "", labels = sprintf("%g", breaks),
                  expand = c(0.02, 0.02), breaks = breaks) +
    theme_light() +
    theme(panel.grid.minor.y = element_blank(),
          panel.grid.minor.x = element_blank(),
          panel.grid.major.y = element_blank(),
          legend.position = "none",
          panel.border = element_blank(),
          axis.title.y = element_blank(),
          axis.text.y = element_blank(),
          axis.ticks.y = element_blank(),
          plot.title = element_text(hjust = 0.5)) +
    xlab("") +
    annotate(geom = "text", x = x_annotate, y = exp(y_variable),
             label = toShowExpClean$var, fontface = "bold",
             hjust = 0, size = annot_size_mm) +
    annotate(geom = "text", x = x_annotate, y = exp(y_nlevel), hjust = 0,
             label = toShowExpClean$level,
             vjust = -0.1, size = annot_size_mm) +
    annotate(geom = "text", x = x_annotate, y = exp(y_nlevel),
             label = toShowExpClean$N, fontface = "italic", hjust = 0,
             vjust = ifelse(toShowExpClean$level == "", 0.5, 1.1),
             size = annot_size_mm) +
    annotate(geom = "text", x = x_annotate, y = exp(y_cistring),
             label = toShowExpClean$estimate.1, size = annot_size_mm,
             vjust = ifelse(toShowExpClean$estimate.1 == "reference", 0.5, -0.1)) +
    annotate(geom = "text", x = x_annotate, y = exp(y_cistring),
             label = toShowExpClean$ci, size = annot_size_mm,
             vjust = 1.1, fontface = "italic") +
    annotate(geom = "text", x = x_annotate, y = exp(y_stars),
             label = toShowExpClean$stars, size = annot_size_mm,
             hjust = -0.2, fontface = "italic") +
    annotate(geom = "text", x = 0.5, y = exp(y_variable),
             label = paste0("# Events: ", gmodel$nevent,
                            "; Global p-value (Log-Rank): ",
                            format.pval(gmodel$p.value.log, eps = ".001"),
                            " \nAIC: ", round(gmodel$AIC, 2),
                            "; Concordance Index: ", round(gmodel$concordance, 2)),
             size = annot_size_mm, hjust = 0, vjust = 1.2, fontface = "italic")
  gt <- ggplot_gtable(ggplot_build(p))
  gt$layout$clip[gt$layout$name == "panel"] <- "off"
  ggpubr::as_ggplot(gt)
}
这是目前ggforest函数的快照,包含了上述相同的修改。如果软件包的创建者在未来进行修改,可能会使此方法失效或过时。但目前情况下,ggforest2(stratamodel)将产生与第一种方法相同的结果。
ggforest是一个包装器,因此使用底层的ggplot编码肯定可以工作。问题在于,熟悉分层模型和ggplot2的SO用户池可能不是很大。如果您可以包括分层模型图应该是什么样子的草图,那么您获得帮助的机会可能会增加。 - Z.Lin