使用ggplot2将不同的图像插入到各个面板中

3

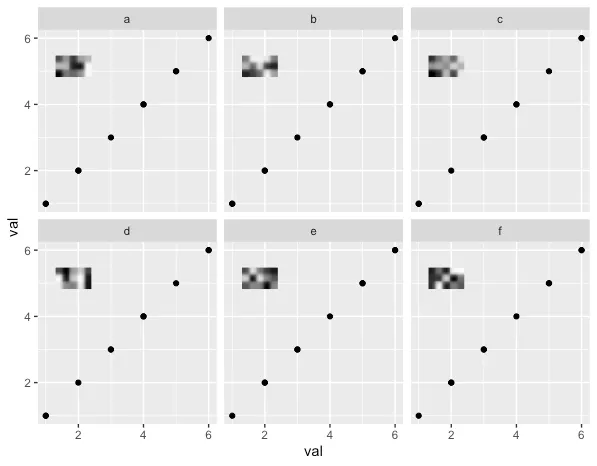
我使用 ggplot2 中的 facet_wrap 创建了一个多面板图,并希望将不同的图像添加到每个面板中。

annotation_custom 可以用于在 ggplot2 中插入图像,但对于所有面板都是相同的。

以下是添加 R logo 的示例:

library(ggplot2)

# Create dataset

df <- data.frame(
    x = rep(seq(1, 5), times = 2),
    y = rep(seq(1, 5), times = 2),
    z = rep(seq(1, 2), each = 5)
)

img <- readPNG(system.file("img", "Rlogo.png", package="png"))

g <- rasterGrob(img, interpolate=TRUE)


ggplot(df) +
    geom_point(aes(x, y)) +
    annotation_custom(g, xmin=-Inf, xmax=Inf, ymin=-Inf, ymax=Inf) +
    facet_wrap(~z)

img2 是由 img 生成的。

img2 <- img * 0.5

在ggplot2中是否可以插入不同的图像(例如将img插入到第1个面板,将img2插入到第2个面板)?

感谢任何建议。如果我的问题不够清晰,请告诉我。


?annotation_custom: 这是一种特殊的“geom”,旨在用作在每个面板中都相同的静态注释。该链接可能有所帮助:https://dev59.com/E4_ea4cB1Zd3GeqPPYfn?answertab=votes#tab-top。 - user20650
1
是的,使用上面链接中的Baptiste函数annotation_custom2似乎可以给出您想要的控制:ggplot(df) + geom_point(aes(x, y)) + facet_wrap(~z) + annotation_custom2(g, data=data.frame(z=1)) - user20650
1个回答

0
这是我解决这个问题的方法。我想在ggplot的每个面板中使用不同的图像(光栅图像)。但是面板数量可能会改变。这是在一个函数内部。请注意,Baptistes的annotate_custom2()函数肯定更干净。https://dev59.com/YlcP5IYBdhLWcg3wP3wU#44897816 我记不清为什么不能让它工作;我想这是因为我事先不知道轴限制或面板数量。
library(ggplot2)
library(grid)
library(stringr)

# Set up list of images
N <- 6
img.list <- list()
for(i in 1:N) img.list[[i]] <- as.raster(matrix(runif(15), ncol = 5, nrow = 3))

# Make a panel plot in ggplot
df <- data.frame(name=letters[1:N], val=rep(1:N, each=10))
ggplot(df, aes(val, val)) + geom_point() + facet_wrap(~name)

# Get the current viewport tree
a <- current.vpTree()
# Get the names of the children viewports with name panel
# For me, the viewport name of my plot was "layout"; might be different
#   in different situations
b <- names(a$children$layout$children)
# find the names of the panel viewports.
# Change if you want the images somewhere else in the plot (like panel titles)
panel.vp <- b[stringr::str_detect(b, "panel-")]

# NOTE! the panel naming is weird. panel-1-2 is not row 1 column 2.
# it is the next numbers that seem to denote the panel row/column

# set up a viewport for my image; always top left
vp.img <- grid::viewport(x=unit(0.1,"npc"), y=unit(0.8,"npc"), width=unit(0.2, "npc"), just = "left")
# add the images to each facet
for(i in 1:N){
  # checkout viewport for panel i
  grid::seekViewport(panel.vp[i])
  # draw my image
  grid::grid.draw(grid::grobTree(grid::rasterGrob(img.list[[i]]), vp=vp.img))
}

rasters added to each panel


网页内容由stack overflow 提供, 点击上面的
可以查看英文原文,
原文链接