在matplotlib的绘图中,我特别想在x轴上用LaTeX标记点,如pi/2、pi、3pi/2等。我该怎么做?
2个回答
28
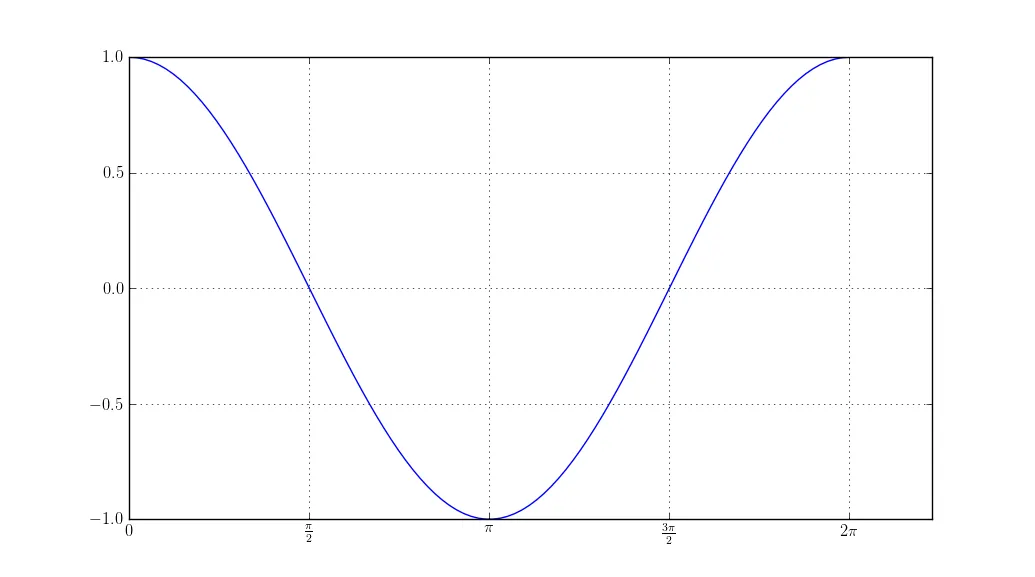
使用 plt.xticks 命令可以放置 LaTeX 刻度线。更多详情请参见此文档页面。
import matplotlib as mpl
import matplotlib.pyplot as plt
import numpy as np

cos = np.cos
pi = np.pi

# This is not necessary if `text.usetex : True` is already set in `matplotlibrc`.
mpl.rc('text', usetex = True)
fig = plt.figure()
ax = fig.add_subplot(1, 1, 1)
t = np.linspace(0.0, 2*pi, 100)
s = cos(t)
plt.plot(t, s)

plt.xticks([0, pi/2, pi, 3*pi/2, 2*pi],
           ['$0$', r'$\frac{\pi}{2}$', r'$\pi$', r'$\frac{3\pi}{2}$', r'$2\pi$'])
plt.show()
- unutbu
3
1
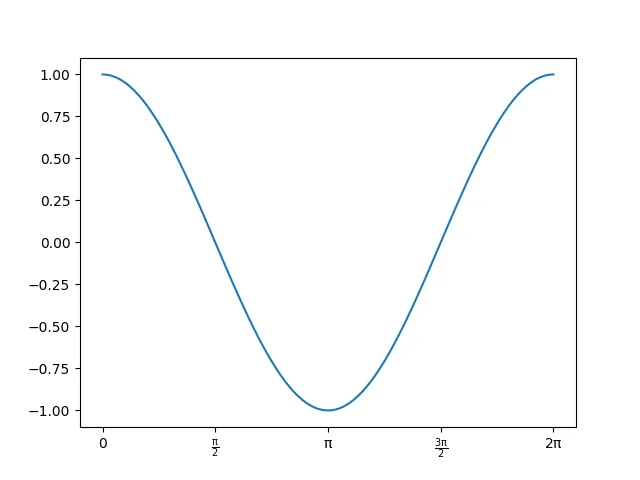
另一种可能性是更新
pyplot rcParams,虽然这可能更像是一种黑客方式而不是合法的方法。import matplotlib.pyplot as plt
import numpy as np
cos = np.cos
pi = np.pi
params = {'mathtext.default': 'regular' } # Allows tex-style title & labels
plt.rcParams.update(params)
fig = plt.figure()
ax = fig.add_subplot(1, 1, 1)
t = np.linspace(0.0, 2*pi, 100)
s = cos(t)
plt.plot(t, s)
ax.set_xticks([0, pi/2, pi, 3*pi/2, 2*pi])
ax.set_xticklabels(['$0$', r'$\frac{\pi}{2}$', r'$\pi$', r'$\frac{3\pi}{2}$', r'$2\pi$'])
plt.show()
- Dan Doe
网页内容由stack overflow 提供, 点击上面的可以查看英文原文,
原文链接
原文链接
- 相关问题
- 5 Python(Matplotlib)-三元图上的刻度标记
- 3 Matplotlib 如何添加字母标记刻度?
- 5 在matplotlib中使用定位器参数更改刻度标记数量
- 3 Matplotlib对数刻度标签,LaTeX字体中减号过长
- 20 Python Matplotlib imshow() 自定义刻度标记
- 10 在LaTeX中用字符串替换字符
- 8 如何关闭Matplotlib坐标轴的刻度和标记?
- 8 如何在matplotlib的colorbar中添加对数刻度小刻度标记?
- 3 Matplotlib/Seaborn直方图中的轴刻度标记
- 6 Matplotlib:刻度标签与字体设置不一致(LaTeX文本示例)
set_xticks,另一个是set_xticklabels。例如,ax.set_xticks([0, pi/2, pi, 3*pi/2, 2*pi])后跟ax.set_xticklabels(['$0$', r'$\frac{\pi}{2}$', r'$\pi$', r'$\frac{3\pi}{2}$', r'$2\pi$'])。 - Aaron Voelkerax.set(xticks=[0, pi/2, pi, 3*pi/2, 2*pi], xticklabels=['$0$', r'$\frac{\pi}{2}$', r'$\pi$', r'$\frac{3\pi}{2}$', r'$2\pi$'])。 - unutbu$,或者忘记转义反斜杠(或使用原始字符串字面量r'')。 - RubenLaguna