给出了一个不错的答案,但如果您想保留的所有功能(非十进制、非整数指数),那么您可能需要创建自己的格式化程序:
import matplotlib.ticker
import matplotlib
import re
matplotlib.rcParams["text.latex.preamble"].append(r'\mathchardef\mhyphen="2D')
class MyLogFormatter(matplotlib.ticker.LogFormatterMathtext):
def __call__(self, x, pos=None):
rv = matplotlib.ticker.LogFormatterMathtext.__call__(self, x, pos)
if matplotlib.rcParams["text.usetex"]:
rv = re.sub(r'\^\{-', r'^{\mhyphen', rv)
return rv
这个功能的主要作用是获取通常格式化程序的输出,找到可能存在的负指数,并将数学减号的LaTeX代码更改为其他内容。当然,如果您使用
\scalebox或等效物发明一些创意LaTex,也可以这样做。
import matplotlib.pyplot as plt
import numpy as np

matplotlib.rcParams["text.usetex"] = True
fig = plt.figure()
ax = fig.add_subplot(111)
ax.semilogy(np.linspace(0,5,200), np.exp(np.linspace(-2,3,200)*np.log(10)))
ax.yaxis.set_major_formatter(MyLogFormatter())
fig.savefig("/tmp/shorthyphen.png")
创建:
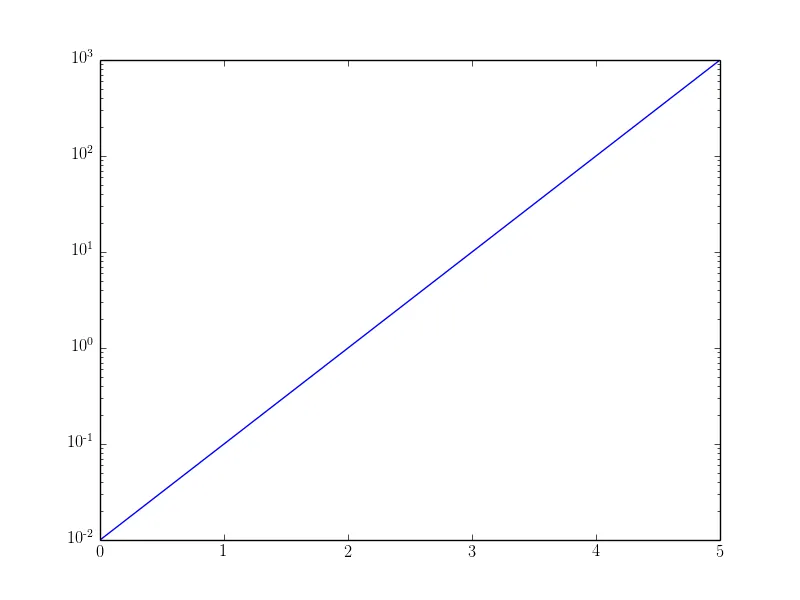
这个解决方案的好处是尽可能地最小化了输出的变化。
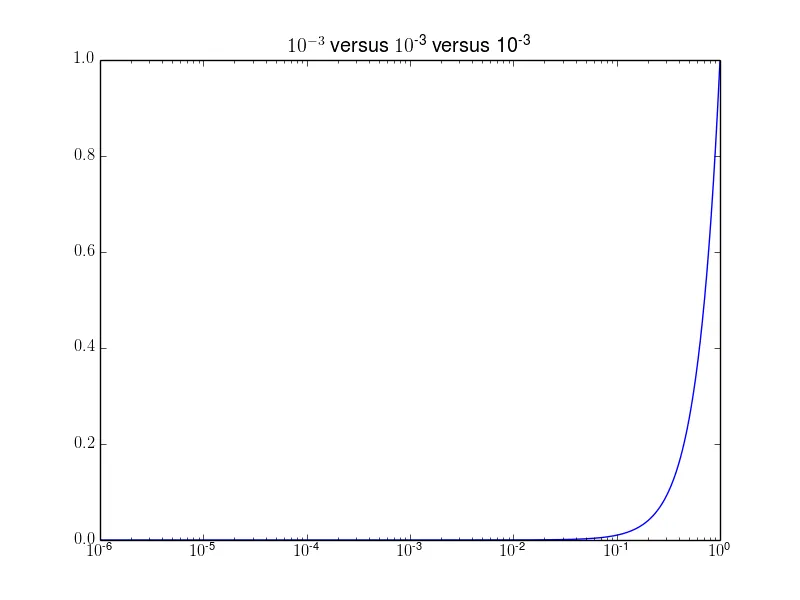
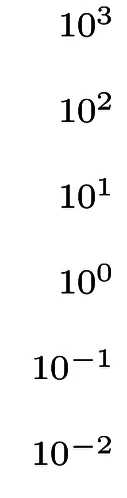 指数中的减号占用了很多水平空间,这不太好看。我想让它看起来更像这样:
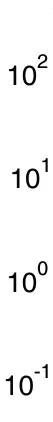 那个来自gnuplot,它没有使用tex-font。我想使用matplotlib,在tex中呈现它,但是10^{-n}中的减号应该更短。这可能吗?