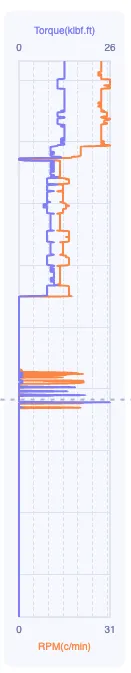
我有一个带有2个数据集的eCharts图表,我想展示2个x轴,一个在图表顶部,另一个在底部。 我必须缺少一些配置设置,因为我无法弄清楚如何显示第二个x轴标签。 第一个x轴正确显示,但第二个x轴只显示轴名称,没有刻度标签。
请参见附带的屏幕截图以进行视觉参考。
我尝试了多个设置,但没有成功,这是我的图表选项:
this.chartOptions = {
        backgroundColor: this.isFirstChart ? '' : '#F7F8FD',
        grid: {
            show: true,
            top: 50,
            left: this.isFirstChart ? 75 : 15,
            right: this.isFirstChart ? 0 : 15,
            bottom: 50,
            borderColor: this.isFirstChart ? '#00000000' : '#DBDDE6',
        },
        yAxis: {
            id: 0,
            gridIndex: 0,
            type: 'time',
            inverse: true,
            data: this.channel1.map(({ time }) => time ?? 0),
            axisLabel: {
                hideOverlap: true,
                show: !!this.isFirstChart,
                formatter: ((ms: number) => DateUtil.format(ms)),
            },
            axisTick: {
                lineStyle: {
                    width: 0
                },
                inside: this.isFirstChart
            },
            axisLine: {
                show: false
            },
            splitLine: {
                show: true
            },
        },
        xAxis: [{
            type: 'value',
            axisLabel: {
                showMinLabel: true,
                showMaxLabel: true,
                fontSize: 10,
                color: '#8086B1',
                show: !this.isFirstChart,
            },
            interval: 1000000,
            axisLine: {
                show: false,
            },
            splitLine: {
                show: true,
                lineStyle: { type: 'dashed' }
            },
            name: this.chartMeta.channelsNames[0],
            nameLocation: 'middle',
            nameGap: 30,
            nameTextStyle: {
                color: this.chartMeta.colors[0]
            },
        },
        {
            type: 'value',
            axisLabel: {
                showMinLabel: true,
                showMaxLabel: true,
                show: !this.isFirstChart,
                fontSize: 10,
                color: '#8086B1',
            },
            interval: 1000000,
            axisLine: {
                show: false,
            },
            splitLine: {
                show: true,
                lineStyle: { type: 'dashed' }
            },
            name: this.chartMeta.channelsNames[1],
            nameLocation: 'middle',
            nameGap: 30,
            nameTextStyle: {
                color: this.chartMeta.colors[1]
            }
        }],
        series: [
            {
                name: this.chartMeta.channelsNames[0],
                type: 'line',
                symbol: 'none',
                connectNulls: true,
                color: this.chartMeta.colors[0],
                data: this.channel1.map((data) => [data.value as number, data.time]),
            },
            {
                name: this.chartMeta.channelsNames[1],
                type: 'line',
                symbol: 'none',
                connectNulls: true,
                color: this.chartMeta.colors[1],
                data: this.channel2.map((data) => [data.value as number, data.time]),

            },
        ],
    };