有人知道获取一对纬度和经度点的中点的最佳方法吗?
我正在使用d3.js在地图上绘制点,并需要在两个点之间画一条曲线,因此我需要创建一个中点以绘制线条中的曲线。
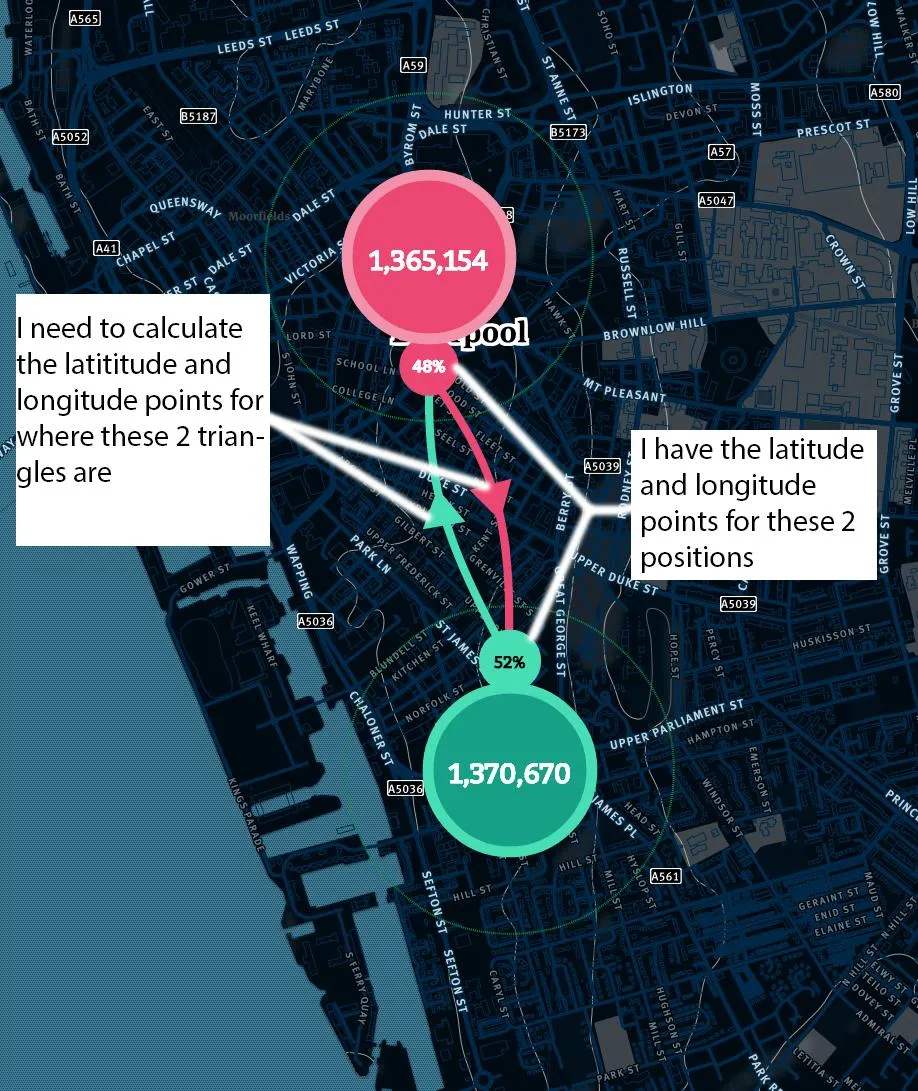
请参考下面的图片更好地理解我的意图:
有人知道获取一对纬度和经度点的中点的最佳方法吗?
我正在使用d3.js在地图上绘制点,并需要在两个点之间画一条曲线,因此我需要创建一个中点以绘制线条中的曲线。
请参考下面的图片更好地理解我的意图:
// your latitude / longitude
var co2 = [70, 48];
var co1 = [-70, -28];


// NOT REQUIRED
var ctx = document.getElementById("myChart").getContext("2d");

function drawPoint(color, point) {
    ctx.fillStyle = color;
    ctx.beginPath();
    ctx.arc(point.x, point.y, 5, 0, 2 * Math.PI, false);
    ctx.fill();
}

function drawCircle(point, r) {
    ctx.strokeStyle = 'gray';
    ctx.setLineDash([5, 5]);
    ctx.beginPath();
    ctx.arc(point.x, point.y, r, 0, 2 * Math.PI, false);
    ctx.stroke();
}


// REQUIRED
// convert to cartesian
var projection = d3.geo.equirectangular()

var cot1 = projection(co1);
var cot2 = projection(co2);

var p0 = { x: cot1[0], y: cot1[1] };
var p1 = { x: cot2[0], y: cot2[1] };


// NOT REQUIRED
drawPoint('green', p0);
drawPoint('green', p1);


// REQUIRED
function dfn(p0, p1) {
    return Math.pow(Math.pow(p0.x - p1.x, 2) + Math.pow(p0.y - p1.y, 2), 0.5);
}

// from http://math.stackexchange.com/a/87374
var d = dfn(p0, p1);
var m = {
    x: (p0.x + p1.x) / 2,
    y: (p0.y + p1.y) / 2,
}

var u = (p1.x - p0.x) / d
var v = (p1.y - p0.y) / d;

// increase 1, if you want a larger curvature
var r = d * 1;
var h = Math.pow(Math.pow(r, 2) - Math.pow(d, 2) / 4, 0.5);

// 2 possible centers
var c1 = {
    x: m.x - h * v,
    y: m.y + h * u
}
var c2 = {
    x: m.x + h * v,
    y: m.y - h * u
}


// NOT REQUIRED
drawPoint('gray', c1)
drawPoint('gray', c2)

drawCircle(c1, r)
drawCircle(c2, r)


// REQUIRED

// from http://math.stackexchange.com/a/919423
function mfn(p0, p1, c) {
    // the -c1 is for moving the center to 0 and back again
    var mt1 = {
        x: r * (p0.x + p1.x - c.x * 2) / Math.pow(Math.pow(p0.x + p1.x - c.x * 2, 2) + Math.pow(p0.y + p1.y - c.y * 2, 2), 0.5)
    };
    mt1.y = (p0.y + p1.y - c.y * 2) / (p0.x + p1.x - c.x * 2) * mt1.x;

    var ma = {
        x: mt1.x + c.x,
        y: mt1.y + c.y,
    }

    var mb = {
        x: -mt1.x + c.x,
        y: -mt1.y + c.y,
    }

    return (dfn(ma, p0) < dfn(mb, p0)) ? ma : mb;
}

var m1 = mfn(p0, p1, c1);
var m2 = mfn(p0, p1, c2);

var mo1 = projection.invert([m1.x, m1.y]);
var mo2 = projection.invert([m2.x, m2.y]);


// NOT REQUIRED
drawPoint('blue', m1);
drawPoint('blue', m2);

// your final output (in lat long)
console.log(mo1);
console.log(mo2);
Fiddle - https://jsfiddle.net/srjuc2gd/
下面是相关部分的代码(其中大部分都与本答案开头类似):
var Q31428016 = (function () {

    // adjust curvature
    var CURVATURE = 1;


    // project to convert from lat / long to cartesian
    var projection = d3.geo.equirectangular();

    // distance between p0 and p1
    function dfn(p0, p1) {
        return Math.pow(Math.pow(p0.x - p1.x, 2) + Math.pow(p0.y - p1.y, 2), 0.5);
    }

    // mid point between p0 and p1
    function cfn(p0, p1) {
        return {
            x: (p0.x + p1.x) / 2,
            y: (p0.y + p1.y) / 2,
        }
    }

    // get arc midpoint given end points, center and radius - http://math.stackexchange.com/a/919423
    function mfn(p0, p1, c, r) {

        var m = cfn(p0, p1);

        // the -c1 is for moving the center to 0 and back again
        var mt1 = {
            x: r * (m.x - c.x) / Math.pow(Math.pow(m.x - c.x, 2) + Math.pow(m.y - c.y, 2), 0.5)
        };
        mt1.y = (m.y - c.y) / (m.x - c.x) * mt1.x;

        var ma = {
            x: mt1.x + c.x,
            y: mt1.y + c.y,
        }

        var mb = {
            x: -mt1.x + c.x,
            y: -mt1.y + c.y,
        }

        return (dfn(ma, p0) < dfn(mb, p0)) ? ma : mb;
    }

    var Q31428016 = {};
    Q31428016.convert = function (co1, co2) {

        // convert to cartesian
        var cot1 = projection(co1);
        var cot2 = projection(co2);

        var p0 = { x: cot1[0], y: cot1[1] };
        var p1 = { x: cot2[0], y: cot2[1] };


        // get center - http://math.stackexchange.com/a/87374
        var d = dfn(p0, p1);
        var m = cfn(p0, p1);

        var u = (p1.x - p0.x) / d
        var v = (p1.y - p0.y) / d;

        var r = d * CURVATURE;
        var h = Math.pow(Math.pow(r, 2) - Math.pow(d, 2) / 4, 0.5);

        // 2 possible centers
        var c1 = {
            x: m.x - h * v,
            y: m.y + h * u
        }
        var c2 = {
            x: m.x + h * v,
            y: m.y - h * u
        }


        // get arc midpoints
        var m1 = mfn(p0, p1, c1, r);
        var m2 = mfn(p0, p1, c2, r);


        // convert back to lat / long
        var mo1 = projection.invert([m1.x, m1.y]);
        var mo2 = projection.invert([m2.x, m2.y]);

        return [mo1, mo2]
    }

    return Q31428016;
})();


// your latitude / longitude
var co1 = [-70, -28];
var co2 = [70, 48];

var mo = Q31428016.convert(co1, co2)

// your output
console.log(mo[0]);
console.log(mo[1]);
对于准确性方面:
您可以使用Esri Web API。在投影系统和数据基准的严格实现方面,数十年的经验无可匹敌......尽管ArcGIS for Server系列是商业产品,但JS API是免费的,在这里有一个纯JS函数可以做到你想要的:geometryEngine.densify;该函数需要一个间隔参数,你可以通过将geometryEngine.geodesicLength的结果除以二来得到。
这将需要您简单了解Polyline类,例如var mySegment = new Polyline([[50,3], [55,8]]);,可能没有更多内容。
对于视觉方面:
您的线段有两个中点?您可能还会对geometryEngine.offset感兴趣;首先向每个方向偏移原始线段一次,然后获取每个结果线段的中心点。
对于实用性方面:
鉴于涉及的距离很短,只要不处理距离极点太近的奇怪地方,我会简单地对X和Y求算术平均值,然后添加/减去一个旋转向量来偏移您的两个“中点”。使用这种方法既可以减轻机器负担(无需从CDN加载库),也更容易上手,并且只要目的是良好的显示,结果就足够好了。
(按照评论添加:示例)
// Your known starting points, and a k factor of your choice.
var a = {x:3, y:50};
var b = {x:8, y:55};
var k = 0.2;

// Intermediate values
var vab =       {x:b.x-a.x, y:b.y-a.y};
var v_rotated = {x:-k*vab.y, y:k*vab.x};
var middle =    {x:a.x+vab.x/2, y:a.y+vab.y/2};

// Your two resulting points
var result_i = {x: middle.x + v_rotated.x,  y: middle.y + v_rotated.y};
var result_j = {x: middle.x - v_rotated.x,  y: middle.y - v_rotated.y};
请参考这篇问题,你可以用它来在谷歌地图上找到坐标的中心点。我对此进行了定制,以便与d3js一起使用。
希望这能帮到你。
在D3中:
function midpoint (lat1, lng1, lat2, lng2) {

lat1= deg2rad(lat1);
lng1= deg2rad(lng1);
lat2= deg2rad(lat2);
lng2= deg2rad(lng2);

dlng = lng2 - lng1;
Bx = Math.cos(lat2) * Math.cos(dlng);
By = Math.cos(lat2) * Math.sin(dlng);
lat3 = Math.atan2( Math.sin(lat1)+Math.sin(lat2),
Math.sqrt((Math.cos(lat1)+Bx)*(Math.cos(lat1)+Bx) + By*By ));
lng3 = lng1 + Math.atan2(By, (Math.cos(lat1) + Bx));

   return (lat3*180)/Math.PI .' '. (lng3*180)/Math.PI;
}

function deg2rad (degrees) {
    return degrees * Math.PI / 180;
};
更新 1
如果您想要绘制曲线,应该使用坐标创建路径,例如:
var lat1=53.507651,lng1=10.046997,lat2=52.234528,lng2=10.695190;


    var svg=d3.select("body").append("svg").attr({width:700 , height:600});
    svg.append("path").attr("d", function (d) {
      var dC="M "+lat1+","+lng1+ " A " + midpoint (lat1, lng1, lat2, lng2)
         + " 0 1,0 " +lat2 +" , "+lng2 +"Z";
        return dC;

    })
    .style("fill","none").style("stroke" ,"steelblue");
在d3中,您需要按照自己的意愿创建曲线。
JsFiddle:这里。