我也在寻找漂亮的矢量化答案,但没有找到。最终,我自己完成了这个任务。我的目的也是尽可能快地加速这些计算。
让我们从这个漂亮的28 x 27图像开始:
import numpy as np
x, y = np.meshgrid(np.linspace(-np.pi/2, np.pi/2, 30), np.linspace(-np.pi/2, np.pi/2, 30))
image = (np.sin(x**2+y**2)[1:-1,1:-2] > 0.9).astype(int) #boolean image
image

 [[0 0 0 0 0 0 0 0 0 0 0 0 0 0 0 0 0 0 0 0 0 0 0 0 0 0 0]
 [0 0 0 0 0 0 0 0 0 0 1 1 1 1 1 1 1 1 0 0 0 0 0 0 0 0 0]
 [0 0 0 0 0 0 0 0 1 1 1 1 1 1 1 1 1 1 1 1 0 0 0 0 0 0 0]
 [0 0 0 0 0 0 1 1 1 1 1 1 1 1 1 1 1 1 1 1 1 1 0 0 0 0 0]
 [0 0 0 0 0 1 1 1 1 1 1 1 0 0 0 0 1 1 1 1 1 1 1 0 0 0 0]
 [0 0 0 0 1 1 1 1 1 0 0 0 0 0 0 0 0 0 0 1 1 1 1 1 0 0 0]
 [0 0 0 1 1 1 1 1 0 0 0 0 0 0 0 0 0 0 0 0 1 1 1 1 1 0 0]
 [0 0 0 1 1 1 1 0 0 0 0 0 0 0 0 0 0 0 0 0 0 1 1 1 1 0 0]
 [0 0 1 1 1 1 0 0 0 0 0 0 0 0 0 0 0 0 0 0 0 0 1 1 1 1 0]
 [0 0 1 1 1 0 0 0 0 0 0 0 0 0 0 0 0 0 0 0 0 0 0 1 1 1 0]
 [0 1 1 1 1 0 0 0 0 0 0 0 0 0 0 0 0 0 0 0 0 0 0 1 1 1 1]
 [0 1 1 1 1 0 0 0 0 0 0 0 0 0 0 0 0 0 0 0 0 0 0 1 1 1 1]
 [0 1 1 1 0 0 0 0 0 0 0 0 0 0 0 0 0 0 0 0 0 0 0 0 1 1 1]
 [0 1 1 1 0 0 0 0 0 0 0 0 0 0 0 0 0 0 0 0 0 0 0 0 1 1 1]
 [0 1 1 1 0 0 0 0 0 0 0 0 0 0 0 0 0 0 0 0 0 0 0 0 1 1 1]
 [0 1 1 1 0 0 0 0 0 0 0 0 0 0 0 0 0 0 0 0 0 0 0 0 1 1 1]
 [0 1 1 1 1 0 0 0 0 0 0 0 0 0 0 0 0 0 0 0 0 0 0 1 1 1 1]
 [0 1 1 1 1 0 0 0 0 0 0 0 0 0 0 0 0 0 0 0 0 0 0 1 1 1 1]
 [0 0 1 1 1 0 0 0 0 0 0 0 0 0 0 0 0 0 0 0 0 0 0 1 1 1 0]
 [0 0 1 1 1 1 0 0 0 0 0 0 0 0 0 0 0 0 0 0 0 0 1 1 1 1 0]
 [0 0 0 1 1 1 1 0 0 0 0 0 0 0 0 0 0 0 0 0 0 1 1 1 1 0 0]
 [0 0 0 1 1 1 1 1 0 0 0 0 0 0 0 0 0 0 0 0 1 1 1 1 1 0 0]
 [0 0 0 0 1 1 1 1 1 0 0 0 0 0 0 0 0 0 0 1 1 1 1 1 0 0 0]
 [0 0 0 0 0 1 1 1 1 1 1 1 0 0 0 0 1 1 1 1 1 1 1 0 0 0 0]
 [0 0 0 0 0 0 1 1 1 1 1 1 1 1 1 1 1 1 1 1 1 1 0 0 0 0 0]
 [0 0 0 0 0 0 0 0 1 1 1 1 1 1 1 1 1 1 1 1 0 0 0 0 0 0 0]
 [0 0 0 0 0 0 0 0 0 0 1 1 1 1 1 1 1 1 0 0 0 0 0 0 0 0 0]
 [0 0 0 0 0 0 0 0 0 0 0 0 0 0 0 0 0 0 0 0 0 0 0 0 0 0 0]]
Networkx
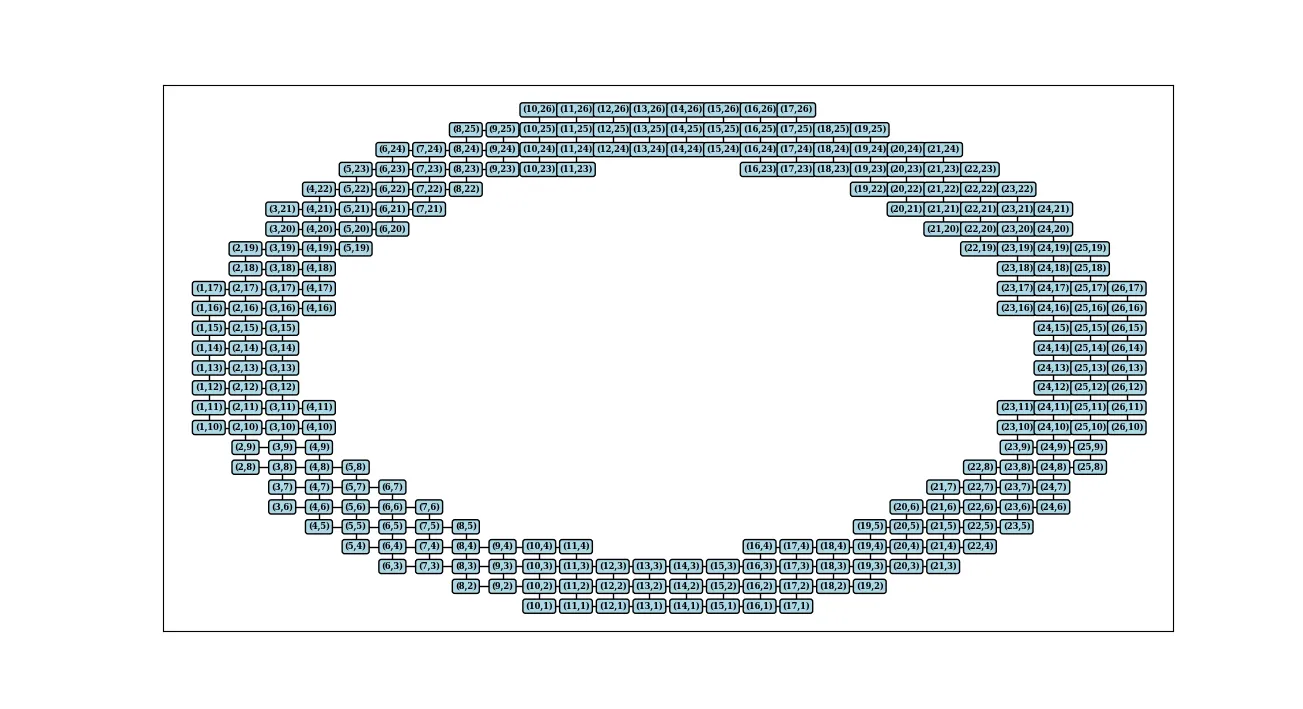
算法的基本原理是识别具有右侧和下方伴侣的单位像素的坐标。网络图的节点应该是任何可哈希的对象,因此我们可以使用元组来标记它们。这很容易实现,尽管不是很高效,因为它需要将np.array的项目转换为元组:
hx, hy = np.where(image[1:] & image[:-1])
h_units = np.array([hx, hy]).T
h_starts = [tuple(n) for n in h_units]
h_ends = [tuple(n) for n in h_units + (1, 0)]
horizontal_edges = zip(h_starts, h_ends)
vx, vy = np.where(image[:,1:] & image[:,:-1])
v_units = np.array([vx, vy]).T
v_starts = [tuple(n) for n in v_units]
v_ends = [tuple(n) for n in v_units + (0, 1)]
vertical_edges = zip(v_starts, v_ends)
让我们看一下它的外观:
G = nx.Graph()
G.add_edges_from(horizontal_edges)
G.add_edges_from(vertical_edges)
pos = dict(zip(G.nodes(), G.nodes()))
nx.draw_networkx(G, pos, with_labels=False, node_size=0)
labels={node: f'({node[0]},{node[1]})' for node in G.nodes()}
nx.draw_networkx_labels(G, pos, labels, font_size=6, font_family='serif', font_weight='bold', bbox = dict(fc='lightblue', ec="black", boxstyle="round", lw=1))
plt.show()
igraph
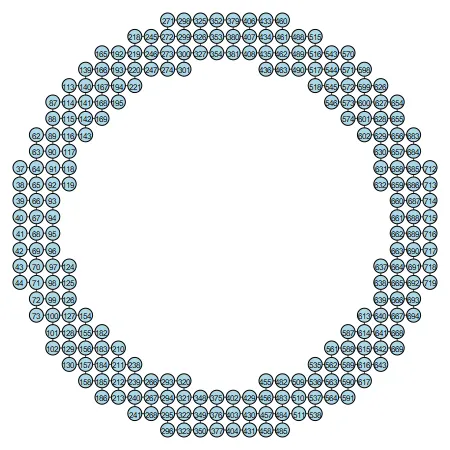
Networkx是纯Python编写的,在处理大数据(如数百万像素的图像)时速度较慢。另一方面,Igraph是用C编写的,但支持较少。文档不是很详细,内部可视化工具使用而不是matplotlib。因此,igraph可能是一个复杂的选择,但如果您使用它,那么在性能方面将获得巨大的优势。在算法实施之前,有一些必须知道的重要事实:
- 节点的索引应该是从0开始的整数。这意味着,如果您在
igraph.add_vertices()中处理其他内容,它将被重新索引为0、1、2等,并且所有旧索引名称都保存在igraph.vs['name']中。
- 在使用
igraph.add_edges()时,不允许包含不存在索引(与0、1、2不同)的边缘。
考虑到这些要求,将图像的维数降低是一个不错的选择,即将像素重命名为整数0、1、2等。现在我们开始吧:
def create_from_edges(edgearray):
g = ig.Graph()
u, inv = np.unique(edgearray, return_inverse=True)
e = inv.reshape(edgearray.shape)
g.add_vertices(u)
g.add_edges(e)
return g
image_idx = np.arange(image.size).reshape(*image.shape)
X, Y = (units.reshape(image.size) for units in np.indices(image.shape))
idx = np.array([X, Y]).T
hx, hy = np.where(image[1:] & image[:-1])
h_starts_idx = image_idx[hx, hy]
h_ends_idx = image_idx[hx+1, hy]
vx, vy = np.where(image[:, 1:] & image[:, :-1])
v_starts_idx = image_idx[vx, vy]
v_ends_idx = image_idx[vx, vy+1]
edgearray = np.vstack([np.array([h_starts_idx, h_ends_idx]).T,
np.array([v_starts_idx, v_ends_idx]).T])
g = create_from_edges(edgearray)
这是我的草图,它展示了顶点名称的新顺序:
ig.plot(g, bbox=(450, 450),
layout = ig.Layout(idx[g.vs['name']].tolist()),
vertex_color = 'lightblue', vertex_label = g.vs['name'], vertex_size=14, vertex_label_size=8)
要求: python-igraph, pycairo(用于绘图)。
PIL读取图像并将其转换为numpy.array。或者直接使用cv2将其读取为numpy.array(但需要将BGR转换为RGB)。然后,您就可以访问图像中的每个像素,并在图表中使用其值。 - furasnetworkx或igraph,您可以将节点的属性设置为值,并赋予它们任何名称(例如“weight”,“color”,“density”等)。看起来您不清楚想要构建算法的方式,因此很难猜测什么是适合您的好解决方案。 - mathfux