我正在使用danielgindi/Charts库,并尝试将Y值放置在X轴下方。
目前的效果如下: 我需要的效果如下:
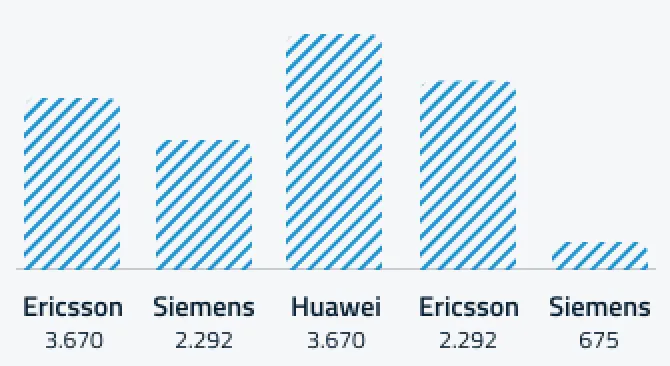
 我的代码:
我的代码:
目前的效果如下:
我需要的效果如下:
我的代码:private func setupBarChart(){
var barChart = BarChartView(frame: frame)
barChartContainer.addSubview(barChart)
let labels = ["Ericsson", "Siemens", "Huawei", "Ericsson", "Siemens"]
barChartContainer.addConstraintsWithFormat("H:|[v0]|", views: barChart)
barChartContainer.addConstraintsWithFormat("V:|[v0]|", views: barChart)
let entry1 = BarChartDataEntry(x: 0, y: 3670)
let set1 = BarChartDataSet(values: [entry1], label: labels[0])
set1.setColor(UIColor.cnBlue)
let entry2 = BarChartDataEntry(x: 1, y: 2292)
let set2 = BarChartDataSet(values: [entry2], label: labels[1])
set2.setColor(UIColor.cnBlue)
let entry3 = BarChartDataEntry(x: 2, y: 3670)
let set3 = BarChartDataSet(values: [entry3], label: labels[2])
set3.setColor(UIColor.cnBlue)
let entry4 = BarChartDataEntry(x: 3, y: 2292)
let set4 = BarChartDataSet(values: [entry4], label: labels[3])
set4.setColor(UIColor.cnBlue)
let entry5 = BarChartDataEntry(x: 4, y: 675)
let set5 = BarChartDataSet(values: [entry5], label: labels[4])
set5.setColor(UIColor.cnBlue)
let data = BarChartData(dataSets: [set1, set2, set3, set4, set5])
barChart.data = data
barChart.drawGridBackgroundEnabled = false
barChart.drawValueAboveBarEnabled = false
barChart.drawBordersEnabled = false
barChart.legend.enabled = false
barChart.chartDescription?.text = "Sites per technology"
barChart.chartDescription?.textAlign = .center
barChart.chartDescription?.position = CGPoint(x: barChartContainer.bounds.width/2, y: 0)
barChart.xAxis.labelPosition = .bottom
barChart.xAxis.drawGridLinesEnabled = false
barChart.xAxis.wordWrapEnabled = true
barChart.xAxis.labelFont = .cnFont(ofSize: 14, weight: .semibold)
barChart.xAxis.valueFormatter = DefaultAxisValueFormatter(block: {(index, _) in
return labels[Int(index)]
})
barChart.leftAxis.enabled = false
barChart.rightAxis.enabled = false
barChart.drawValueAboveBarEnabled = false
barChart.doubleTapToZoomEnabled = false
barChart.pinchZoomEnabled = false
barChart.scaleXEnabled = false
barChart.scaleYEnabled = false
barChart.setExtraOffsets(left: 10, top: 10, right: 10, bottom: 10)
barChart.fitBars = true
barChart.animate(xAxisDuration: 1, yAxisDuration: 1, easingOption: .easeInOutCirc)
}
我是否需要创建自定义的AxisRenderer,如果需要的话,你能给我一些指引吗?我一直在寻找示例,但仍然无法理解如何使用渲染器获得所需的内容。
提前感谢您!