这是图表视图的截图。
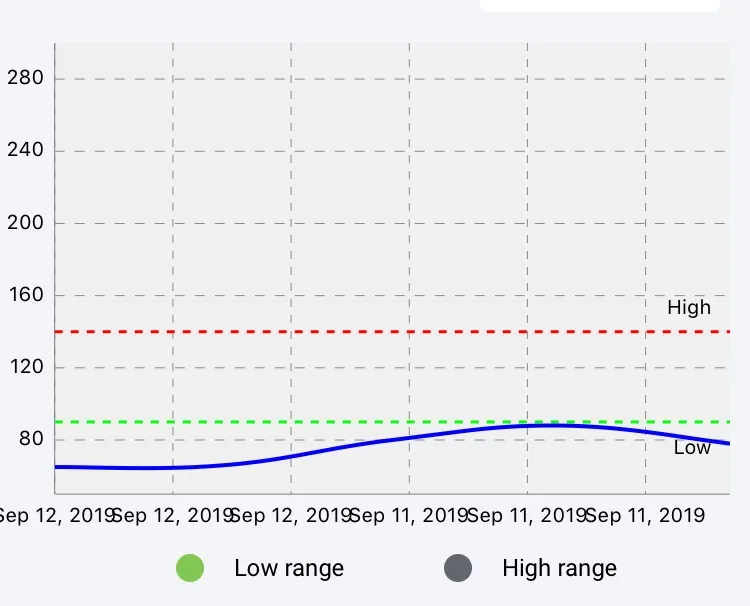
x轴上的数值(日期)重叠了。
 axisMinValue = 50.0
 axixMaxvalue = 300.0

unitsSold = [65.0,88.0, 114.0, 111.0, 88.0 ]
months = ["Sep 12, 2019”,"Sep 12, 2019”,"Sep 12, 2019”,"Sep 11, 2019”,"Sep 11, 2019"]
这是我写的代码,
    if unitsSold.count < 1{

         cell.chartViewOutlet.noDataText = "No data available!"
    }
    else{

        dataEntries = []
        for i in 0 ..< unitsSold.count {
            let dataEntry = ChartDataEntry(x: Double(i), y: unitsSold[i])
            dataEntries.append(dataEntry) // here we add it to the data set
        }

        let lineChartDataSet = LineChartDataSet(values: dataEntries, label: "Units Consumed")

        lineChartDataSet.setCircleColor(UIColor.clear) // hide the outer circle color
        lineChartDataSet.circleRadius = 0.0
        lineChartDataSet.lineWidth = 2.0 //1.0
        lineChartDataSet.valueTextColor = UIColor.clear //hide the values on the curve line


        lineChartDataSet.colors = [NSUIColor.blue] //Sets the line colour to blue
        lineChartDataSet.mode = .cubicBezier
        lineChartDataSet.cubicIntensity = 0.2

        var dataSets = [LineChartDataSet]()
        dataSets.append(lineChartDataSet)

        let lineChartData = LineChartData(dataSets: dataSets)
        cell.chartViewOutlet.data = lineChartData

        cell.chartViewOutlet.chartDescription?.text = ""

        cell.chartViewOutlet.xAxis.enabled = true
        cell.chartViewOutlet.leftAxis.enabled = true
        cell.chartViewOutlet.rightAxis.enabled = false
        cell.chartViewOutlet.animate(xAxisDuration: 1.5)
        cell.chartViewOutlet.drawGridBackgroundEnabled = true


        cell.chartViewOutlet.xAxis.drawGridLinesEnabled = true
        cell.chartViewOutlet.xAxis.drawAxisLineEnabled = true

        cell.chartViewOutlet.xAxis.labelPosition = .bottom
        cell.chartViewOutlet.xAxis.drawLabelsEnabled = true


        cell.chartViewOutlet.leftAxis.drawGridLinesEnabled = true

        cell.chartViewOutlet.legend.enabled = false //show.hide legend - below graph


        let customFormater = CustomFormatter1()
        customFormater.labels =  months
        cell.chartViewOutlet.xAxis.valueFormatter = customFormater
// 在 x 轴上显示数值
final class CustomFormatter1: IAxisValueFormatter {

var labels: [String] = []

func stringForValue(_ value: Double, axis: AxisBase?) -> String {

    let count = self.labels.count

    guard let axis = axis, count > 0 else {
        return ""
    }

    let factor = axis.axisMaximum / Double(count)

    let index = Int((value / factor).rounded())

    if index >= 0 && index < count {
        return self.labels[index]
    }

    return ""
}
我们该如何解决这个重叠问题?或者有没有什么方法可以使这些值根据屏幕或月份长度自动调整?
cell.chartViewOutlet.xAxis.labelRotationAngle = -45。 - Kamran