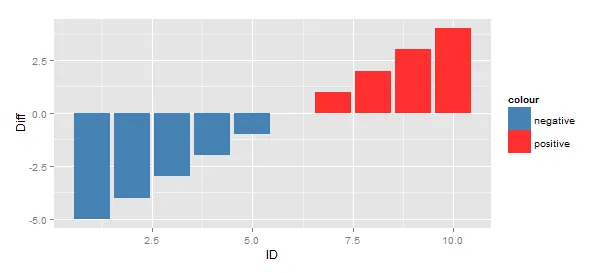
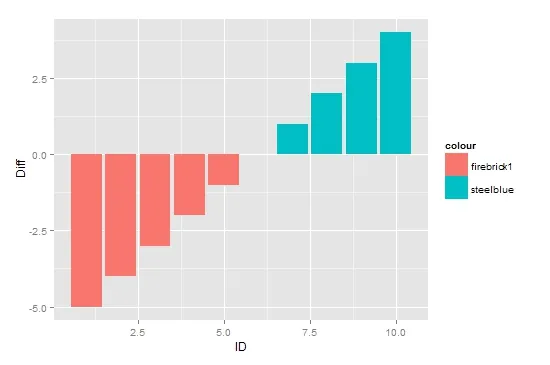
我昨天刚开始接触ggplot。我的带有负值的柱状图代码效果如预期:
dtf1 <- data.frame(ID = c(1:10),Diff = c(-5:4))
dtf1$colour <- ifelse(dtf1$Diff < 0, "firebrick1","steelblue")
dtf1$hjust <- ifelse(dtf1$Diff > 0, 1.3, -0.3)
ggplot(dtf1,aes(ID,Diff,label="",hjust=hjust))+
  geom_text(aes(y=0,colour=colour))+
  geom_bar(stat="identity",position="identity",aes(fill = colour))
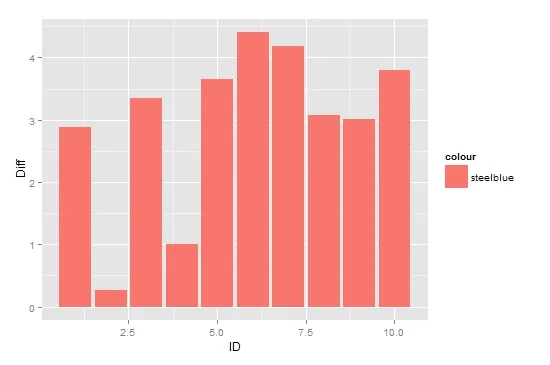
 但是,当我将相同的代码应用于仅具有正值的不同数据集时情况并非如此。
dtf <- data.frame(ID = c(1:10),Diff = rnorm(10,3))
dtf$colour <- ifelse(dtf$Diff < 0, "firebrick1","steelblue")
dtf$hjust <- ifelse(dtf$Diff > 0, 1.3, -0.3)
ggplot(dtf,aes(ID,Diff,label="",hjust=hjust))+
  geom_text(aes(y=0,colour=colour))+
  geom_bar(stat="identity",position="identity",aes(fill = colour))
我发现我可以调整代码的最后一行,以获得我的正数条形图的蓝色颜色,
geom_bar(stat="identity",position="identity",fill="steelblue")
因此,我的两个问题是:
- 然而,颜色并不如预期:
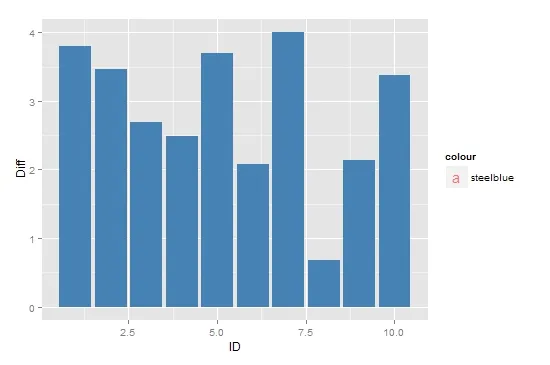
看起来颜色可能更接近于turquoise3而不是steelblue。
- 此外,我还想知道为什么相同的代码会允许正数条具有不同的颜色。
我肯定问了一个非常简单的问题。我不知道该如何更好地表达它,因此很难找到解决方案。如果已经有人问过这个问题,我会很高兴删除自己。