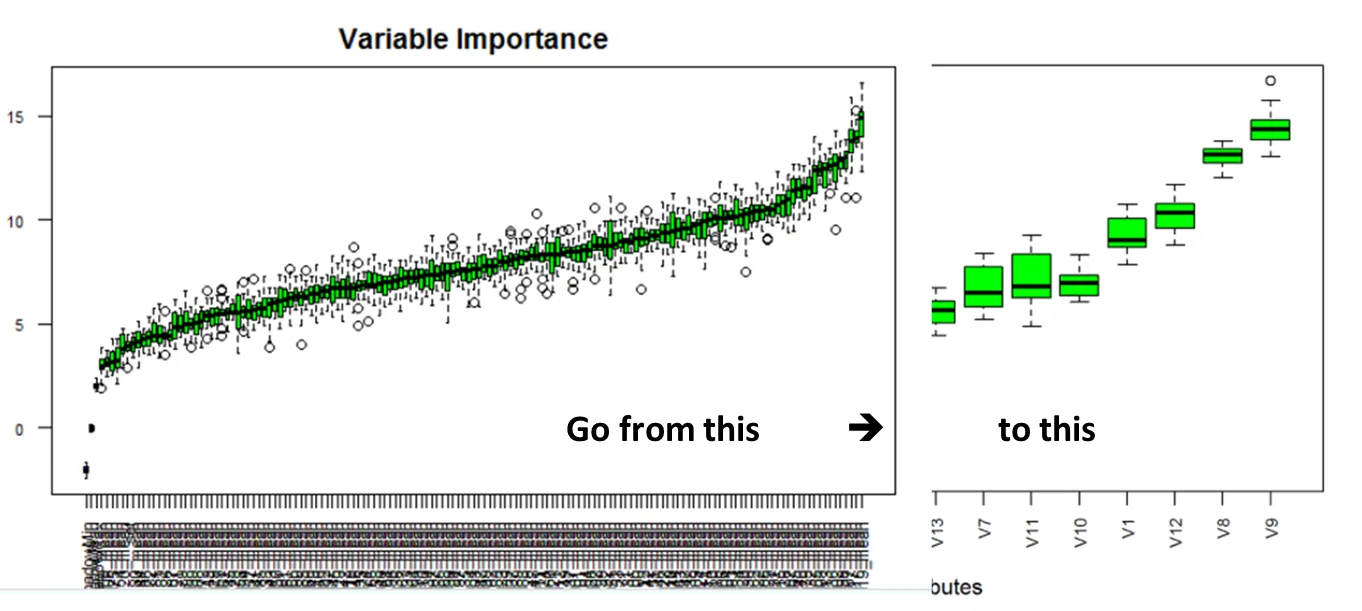
我正在使用R中的Boruta包进行变量选择。Boruta在单个图形中给出了标准的一系列箱线图,这很有用,但考虑到我有太多的预测变量,我希望能够限制出现在Boruta图中的箱线图数量。就像以下图片一样。
plot.Boruta创建了一个新函数,并添加了一个函数参数pars,它接受我们想要包含在图中的变量/预测器的名称。iris数据集来拟合模型。# Fit model to the iris dataset
library(Boruta);
fit <- Boruta(Species ~ ., data = iris, doTrace = 2);
generateCol函数是被plot.Boruta内部调用的,但它没有被导出,因此在包外不可用。 然而,我们需要该函数来修订我们的plot.Boruta程序。
# generateCol is needed by plot.Boruta
generateCol<-function(x,colCode,col,numShadow){
 #Checking arguments
 if(is.null(col) & length(colCode)!=4)
  stop('colCode should have 4 elements.');
 #Generating col
 if(is.null(col)){
  rep(colCode[4],length(x$finalDecision)+numShadow)->cc;
  cc[c(x$finalDecision=='Confirmed',rep(FALSE,numShadow))]<-colCode[1];
  cc[c(x$finalDecision=='Tentative',rep(FALSE,numShadow))]<-colCode[2];
  cc[c(x$finalDecision=='Rejected',rep(FALSE,numShadow))]<-colCode[3];
  col=cc;
 }
 return(col);
}
plot.Boruta函数,并添加一个函数参数pars,通过该参数我们过滤变量列表。# Modified plot.Boruta
plot.Boruta.sel <- function(
x,
pars = NULL,
colCode = c('green','yellow','red','blue'),
sort = TRUE,
whichShadow = c(TRUE, TRUE, TRUE),
col = NULL, xlab = 'Attributes', ylab = 'Importance', ...) {
#Checking arguments
if(class(x)!='Boruta')
stop('This function needs Boruta object as an argument.');
if(is.null(x$ImpHistory))
stop('Importance history was not stored during the Boruta run.');
#Removal of -Infs and conversion to a list
lz <- lapply(1:ncol(x$ImpHistory), function(i)
x$ImpHistory[is.finite(x$ImpHistory[,i]),i]);
colnames(x$ImpHistory)->names(lz);
#Selection of shadow meta-attributes
numShadow <- sum(whichShadow);
lz <- lz[c(rep(TRUE,length(x$finalDecision)), whichShadow)];
#Generating color vector
col <- generateCol(x, colCode, col, numShadow);
#Ordering boxes due to attribute median importance
if (sort) {
ii <- order(sapply(lz, stats::median));
lz <- lz[ii];
col <- col[ii];
}
# Select parameters of interest
if (!is.null(pars)) lz <- lz[names(lz) %in% pars];
#Final plotting
graphics::boxplot(lz, xlab = xlab, ylab = ylab, col = col, ...);
invisible(x);
}
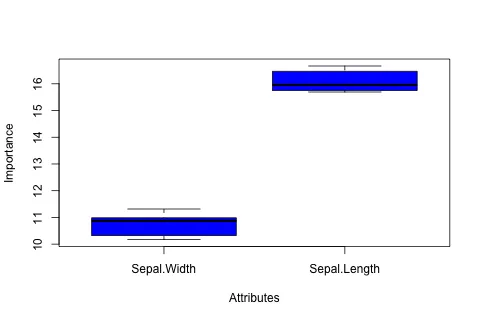
plot.Boruta.sel而不是plot,并指定我们想要包括的变量。plot.Boruta.sel(fit, pars = c("Sepal.Length", "Sepal.Width"));
`#Final plotting graphics::boxplot(lz, xlab = xlab, ylab = ylab, col = col, ...); invisible(x);`因此,你可以通过设置col = "g"来选择绿色。 - Amir Charkhidata.frame? - Maurits Evers