使用ggplot2在圆形包装中可视化分层数据?

7

我有一些层次数据,例如,

> library(dplyr)
> df <- data_frame(id = 1:6, parent_id = c(NA, 1, 1, 2, 2, 5))
> df
Source: local data frame [6 x 2]

     id parent_id
  (int)     (dbl)
1     1        NA
2     2         1
3     3         1
4     4         2
5     5         2
6     6         5

我想通过一个圆形包装图来绘制树的“自上而下”的视图: http://bl.ocks.org/mbostock/4063530

circle packing plot

上面的链接是一个d3库。是否有相应的库可以让我在ggplot2中制作这样的图表?
(我想在一个shiny应用程序中使用此图表,该应用程序支持d3,但我以前没有使用过d3,对学习曲线不确定。如果d3是明显的选择,我将尝试使其工作。谢谢。)
1个回答

12

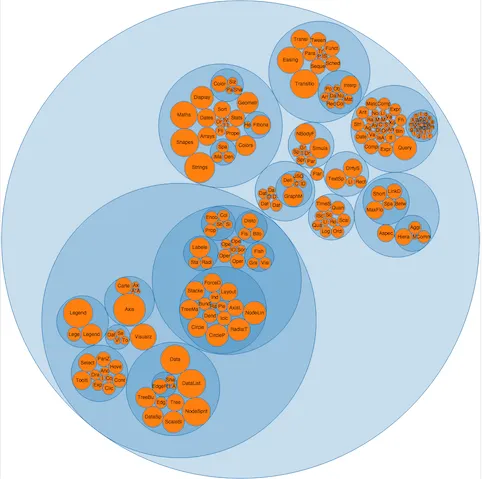
有两个步骤:(1) 聚合数据,然后 (2) 转换为json。在那个示例页面中,所有的javascript代码都已经编写好了,所以你只需要插入转换后的json数据即可。

由于聚合后的数据应该具有类似于树形图的结构,因此我们可以使用treemap软件包来进行聚合(也可以使用循环进行连续聚合)。然后,使用d3treeR(来自github)将树状图数据转换为嵌套列表,并使用jsonlite将列表转换为json。

我正在使用一些示例数据GNI2010,它可以在d3treeR包中找到。你可以在plunker上查看所有源文件。

library(treemap)
library(d3treeR)  # devtools::install_github("timelyportfolio/d3treeR")
library(data.tree)
library(jsonlite)

## Get treemap data using package treemap
## Using example data GNI2010 from d3treeR package
data(GNI2010)

## aggregate by these: continent, iso3,
## size by population, and color by GNI
indexList <- c('continent', 'iso3')  
treedat <- treemap(GNI2010, index=indexList, vSize='population', vColor='GNI',
               type="value", fun.aggregate = "sum",
               palette = 'RdYlBu')
treedat <- treedat$tm  # pull out the data

## Use d3treeR to convert to nested list structure
## Call the root node 'flare' so we can just plug it into the example
res <- d3treeR:::convert_treemap(treedat, rootname="flare")

## Convert to JSON using jsonlite::toJSON
json <- toJSON(res, auto_unbox = TRUE)

## Save the json to a directory with the example index.html
writeLines(json, "d3circle/flare.json")

我还替换了示例index.html中的源代码行为:

  <script src="https://cdnjs.cloudflare.com/ajax/libs/d3/3.5.5/d3.min.js"></script>

然后启动 index.html,您应该会看到 enter image description here

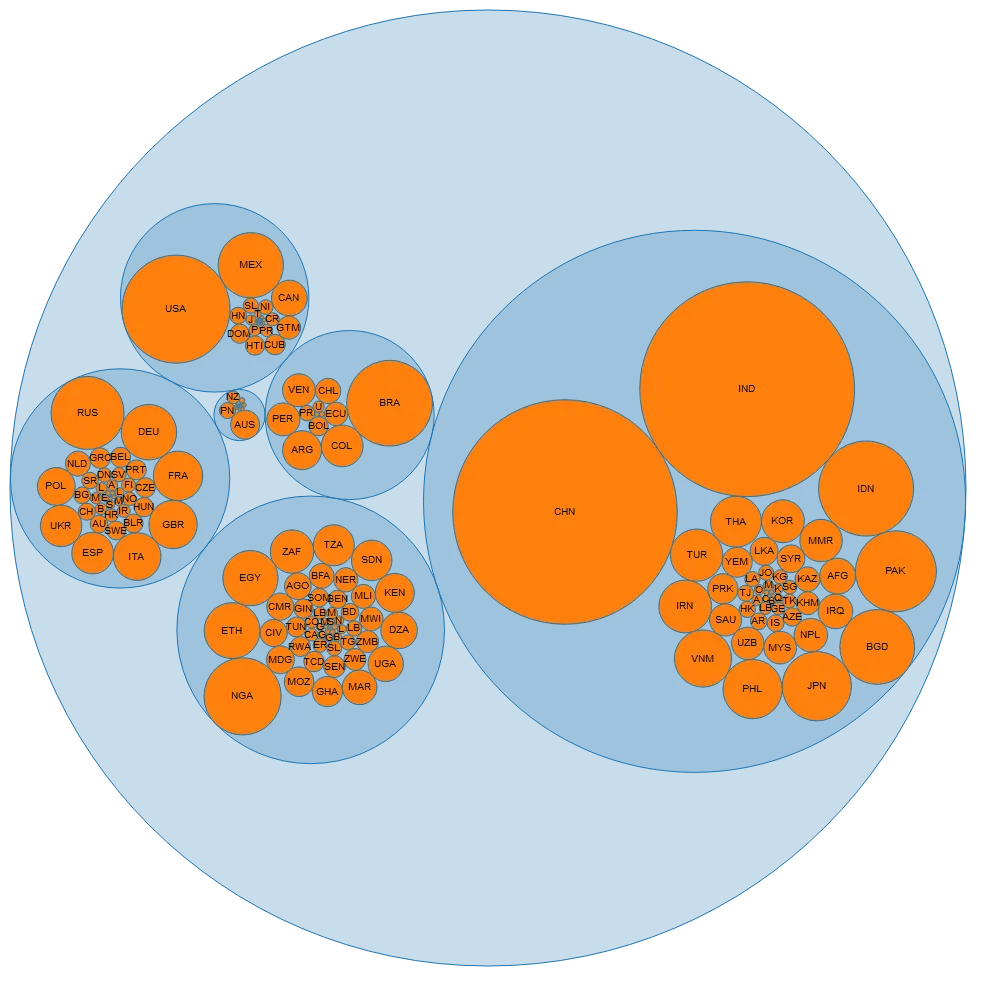
要创建亮闪闪的绑定(shiny bindings),可以使用 htmlwidgets 并参考一些示例(d3treeR 源代码中有一些)。请注意,某些功能可能无法正常工作,例如着色。这里存储的 json 实际上包含有关节点的大量信息(使用 treemap 聚合的所有数据),您可以在图表中利用这些信息。


1
太好了,谢谢!我很惊讶你能这么快地解决问题。我已经成功复制了你的答案,除了 htmlwidgets 部分之外没有任何问题。我遇到的唯一问题是(如果有帮助的话):(1)我必须先运行 data(GNI2010)。 (2)最初 index.html 加载了一个空白页面,通过按照 这个 stackoverflow 答案 中描述的方法启动本地服务器解决了这个问题。 - Eric
太好了!我本来想进一步制作htmlwidget,但我没有相关经验。不过,看着这段代码https://github.com/timelyportfolio/d3treeR/blob/master/R/d3tree.R#L122,感觉很容易实现。 - Rorschach
1
非常感谢您的回答。此外,您可能想看一下 data.tree https://github.com/gluc/data.tree 用于聚合和树形操作。我发现它非常有帮助。 - timelyportfolio
什么是对象“GNI2010”?R在提供的解决方案中找不到它。 - user3245256
@user3245256 我相信需要被加载,可以看看第一条评论。 - Rorschach
显示剩余3条评论

网页内容由stack overflow 提供, 点击上面的
可以查看英文原文,
原文链接