加快绘制样条曲线的染色段速度?

5

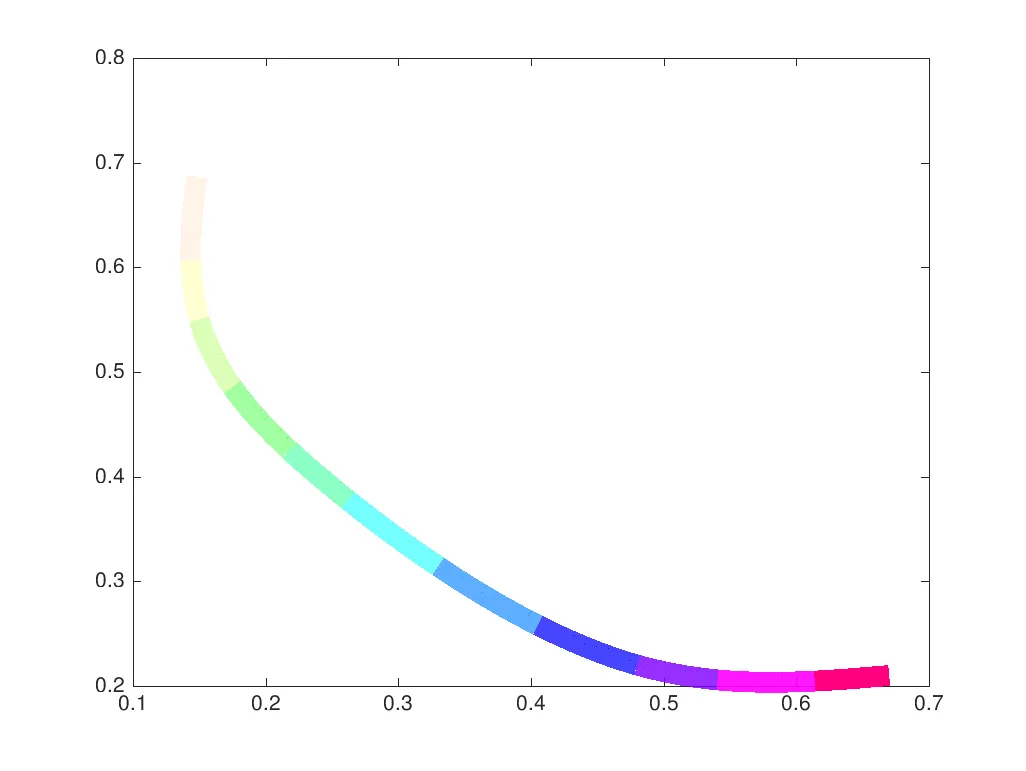
我正在尝试使用不同的RGB值对样条曲线的各个部分进行着色。非常感谢@Suever,我已经有了一个可用的版本:

x = [0.16;0.15;0.25;0.48;0.67];
y = [0.77;0.55;0.39;0.22;0.21];
spcv = cscvn([x, y].'); % spline curve
N = size(x, 1);
figure;
hold on;
for idx = 1:N-2
    before = get(gca, 'children'); % before plotting this segment
    fnplt(spcv, spcv.breaks([idx, idx+1]), 2);
    after = get(gca, 'children'); % after plotting this segment
    new = setdiff(after, before);
    set(new, 'Color', [idx/N, 1-idx/N, 0, idx/N]); % set new segment to a specific RGBA color
end
hold off;

现在我想加速它。这是可能的吗?

标题有误导性,因为瓶颈在于样条拟合函数fnplt(),而不是绘图的着色/渲染。 - Oleg
1个回答

4
没有明确的基准测试,但您可以通过以下方式轻松进行向量化:
a. 收集绘制的点并将它们分成“段”(例如使用buffer函数)
b. 设置Children的'color'属性(感谢@Suever指出这可以直接在对象句柄数组上完成
%% Get spline curve
x = [0.16; 0.15; 0.25; 0.48; 0.67];
y = [0.77; 0.55; 0.39; 0.22; 0.21];
spcv = cscvn ([x, y].');

%% Split into segments
pts = fnplt (spcv);   xpts = pts(1,:).';   ypts = pts(2,:).';
idx = buffer ([1 : length(xpts)]', 10, 1, 'nodelay'); % 10pt segments
lastidx=idx(:,end); lastidx(lastidx==0)=[]; idx(:,end)=[]; % correct last segment

% Plot segments
plot (xpts(idx), ypts(idx), xpts(lastidx), ypts(lastidx), 'linewidth', 10);

% Adjust colour and transparency
Children = flipud (get (gca, 'children'));
Colours  = hsv (size (Children, 1)); % generate from colourmap
Alphas   = linspace (0, 1, length (Children)).'; % for example
set (Children, {'color'}, num2cell([Colours, Alphas],2));

enter image description here

< p > 注意: 正如评论区所指出的一样 (感谢@Dev-iL),按照您的要求将颜色设置为RGBA四元组 (而不是简单的RGB三元组) 是一个较新的 (目前也是未记录) Matlab 特性。例如,这段代码在2013b中将无法工作。


1
+1;谢谢!抱歉,我应该在我的实际情况中提到,我实际上需要RGBA而不是RGB。我认为“ColorOrder”无法处理RGBA。问题已更新。 - Sibbs Gambling
1
不,实际上它使用color属性工作,例如set(new,'Color',[idx/N,1-idx/N,0,idx/N])。我刚在R2016a上测试过了。 - Sibbs Gambling
1
啊,好的。抱歉,我还在使用2013b版本。这一定是一个新功能 :) - Tasos Papastylianou
1
@TasosPapastylianou RGBA选项是未记录的。通常在打开设置颜色时调用的.m文件中可以看到它,如果我没记错的话,有一个switch检查格式... - Dev-iL
1
你也可以使用 set(Children, {'Color'}, values) 的方式一次性设置所有颜色。 - Suever
显示剩余2条评论

网页内容由stack overflow 提供, 点击上面的
可以查看英文原文,
原文链接