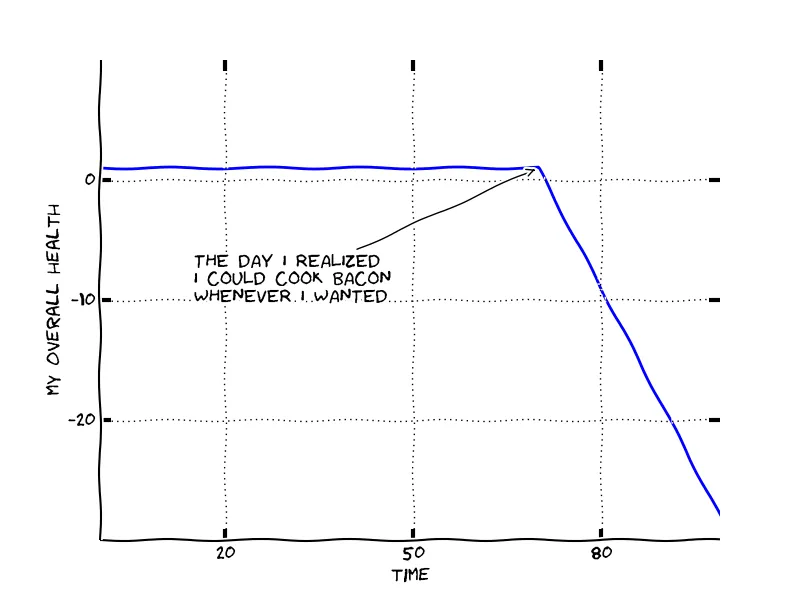
我想创建一些带有网格背景的xkcd图。就像这个例子,但是当使用plt.xkcd()时,网格不会出现在图表中。
from matplotlib import pyplot as plt
import numpy as np

plt.xkcd()
fig = plt.figure()
ax = fig.add_subplot(1, 1, 1)
ax.spines['right'].set_color('none')
ax.spines['top'].set_color('none')
plt.xticks([])
plt.yticks([])
ax.set_ylim([-30, 10])
plt.grid()

data = np.ones(100)
data[70:] -= np.arange(30)

plt.annotate(
    'THE DAY I REALIZED\nI COULD COOK BACON\nWHENEVER I WANTED',
    xy=(70, 1), arrowprops=dict(arrowstyle='->'), xytext=(15, -10))

plt.plot(data)

plt.xlabel('time')
plt.ylabel('my overall health')

plt.show()
在使用mplot3d绘制图形的情况下,网格是“有效”的,可以在此示例中看到:example。尽管如此,该网格似乎是“完美的”。我该如何创建这些网格?
 带网格的示例:
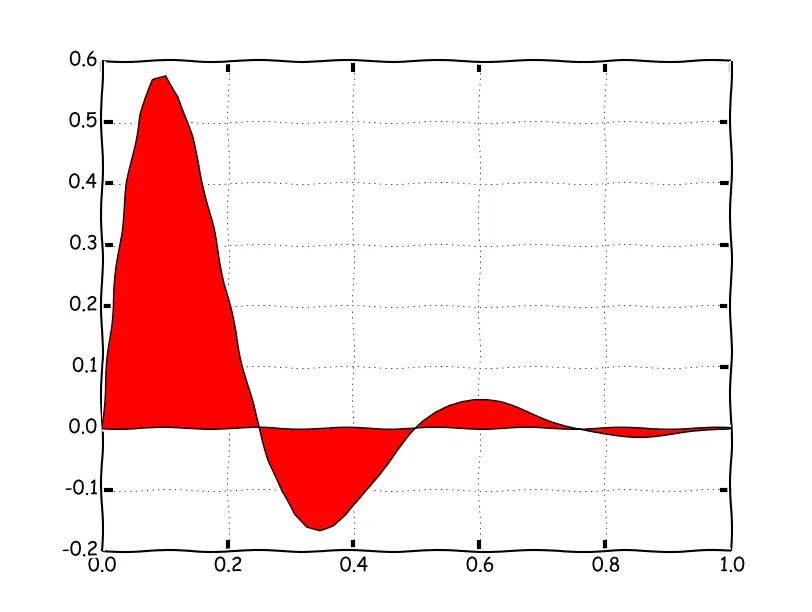
from matplotlib import pyplot as plt import numpy as np x = np.linspace(0,10,200) plt.xkcd() plt.plot(x,np.sin(x), zorder=3); plt.grid(True, lw=1, zorder=0) plt.show()- nicoguaro