使用分段线性函数低估f(x)

3

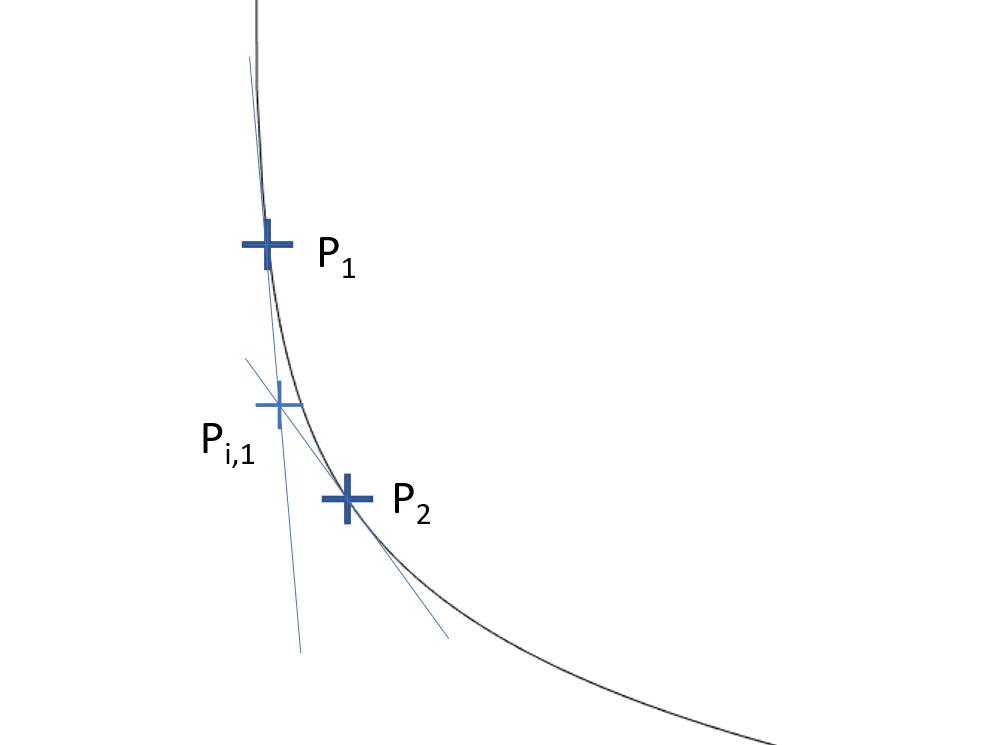
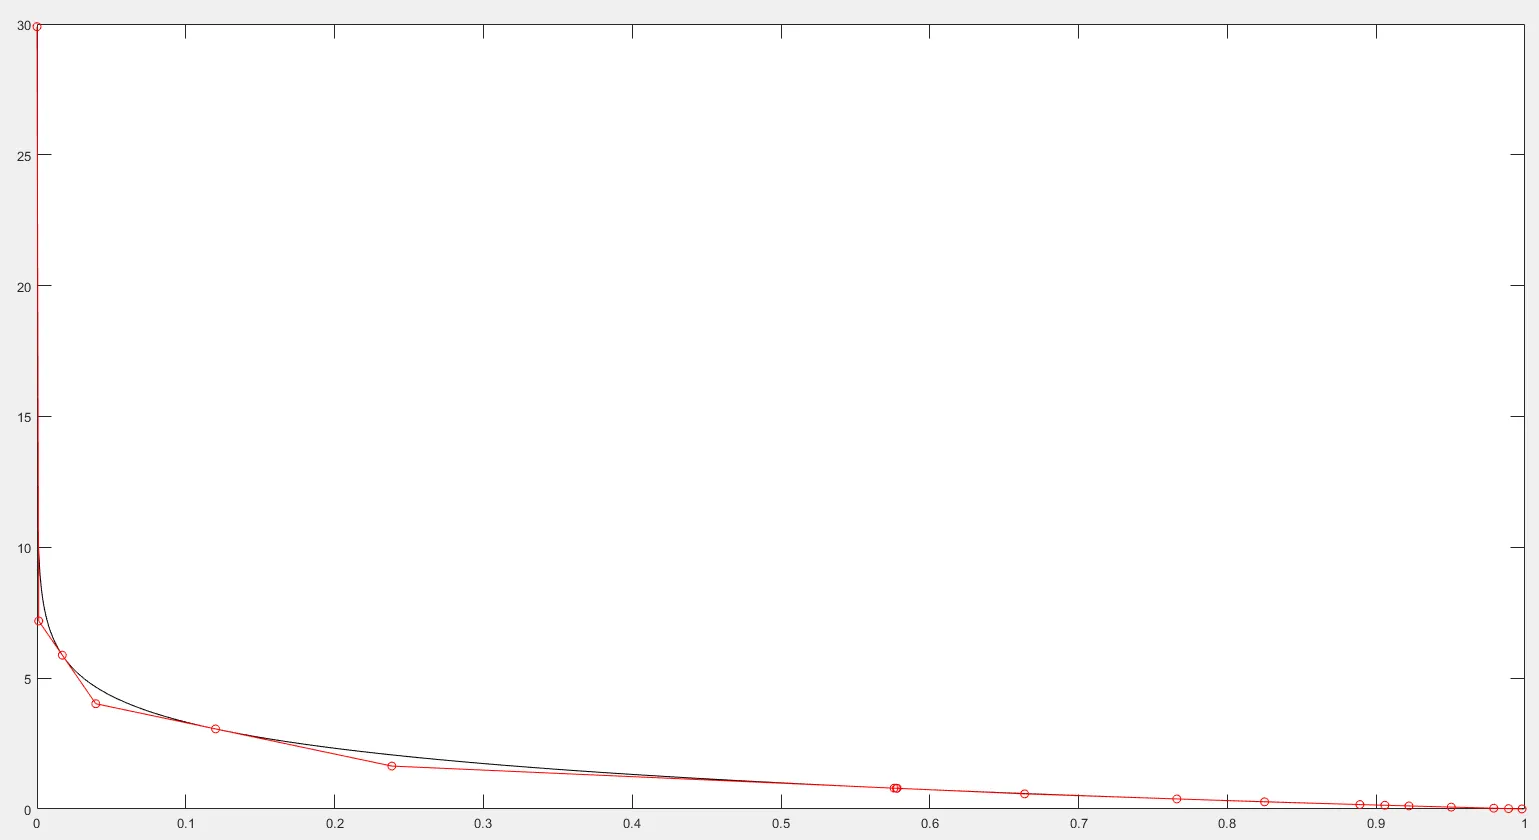
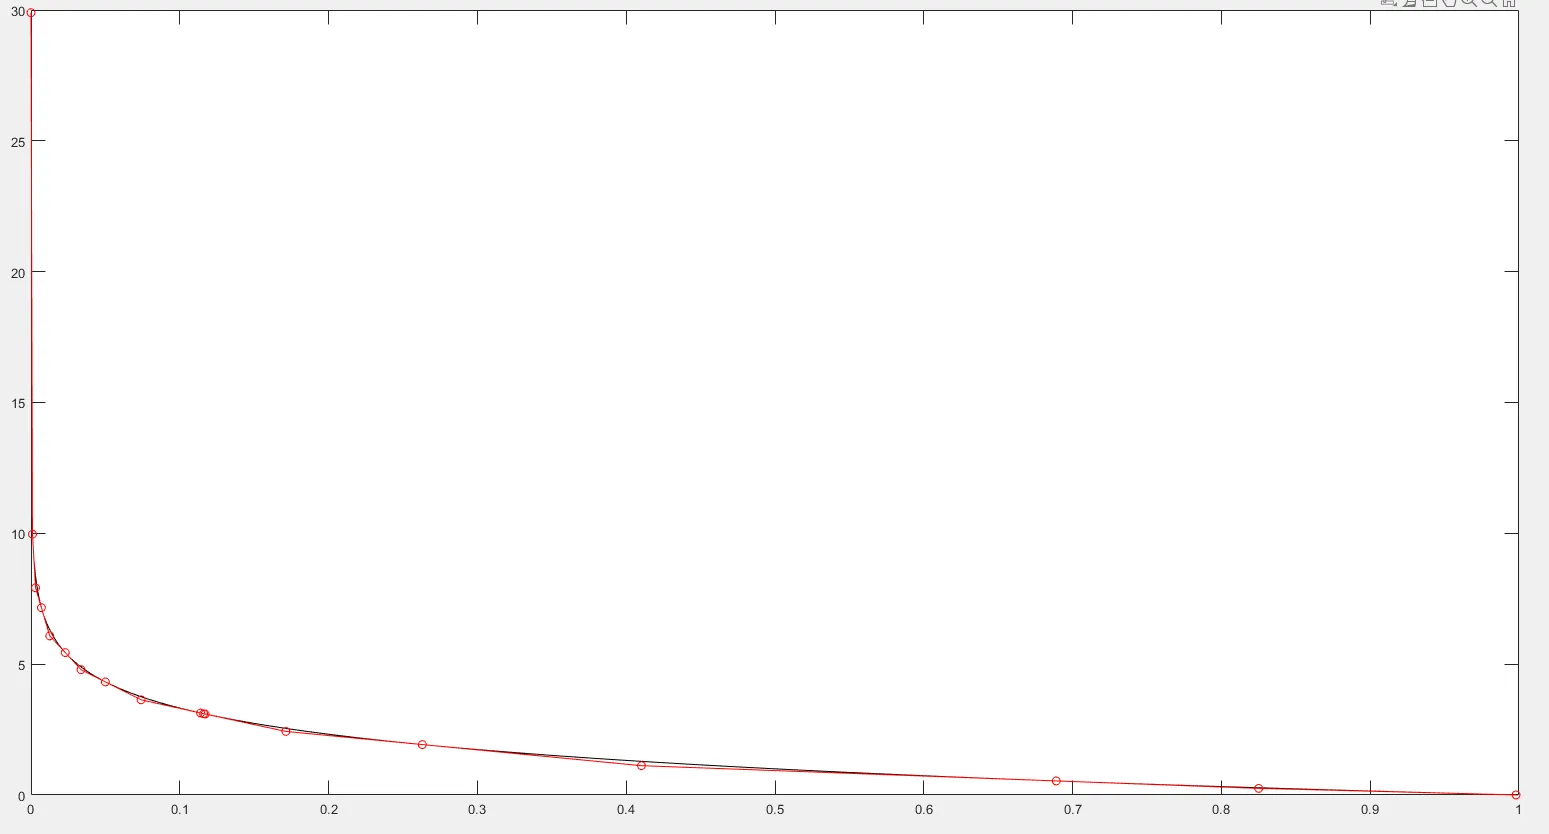
我正在尝试查找是否有Matlab/Python过程可以使用分段线性函数g(x)低估f(x)。即g(x)需要小于等于f(x)。请参见下面的图片和代码。您能否帮助修改此代码以找到如何低估这个函数?

 x = 0.000000001:0.001:1;
 y = abs(f(x));

 %# Find section sizes, by using an inverse of the approximation of the derivative
 numOfSections = 5;
 totalRange = max(x(:))-min(x(:));

 %# The relevant nodes
 xNodes = x(1) + [ 0 cumsum(sectionSize)];
 yNodes = abs(f(xNodes));

 figure;plot(x,y);
 hold on;
 plot (xNodes,yNodes,'r');
 scatter (xNodes,yNodes,'r');
 legend('abs(f(x))','adaptive linear interpolation');

基本上,我的意思是低估=凸包。 - Juan
2
一种可能的方法是:在某些点上对原始函数进行_value_和_derivative_的采样,并使用通过这些点并具有这些斜率的线性片段。 - Luis Mendo
@mhopeng 我不这么认为,因为生物共轭会给我一个连续的非线性函数,而我需要一个分段线性函数。 - Juan
@LuisMendo 好的,但是容错性如何?或者分配样本点的更好方法是什么? - Juan
如果您想保证最大误差或优化点的选择,那就是一个不同的问题,似乎更难(并且不包含在您最初的问题中)。 - Luis Mendo
显示剩余3条评论
1个回答

3
这种方法基于Luis Mendo的评论,其思路如下:
  1. 从原始曲线中选择一些点,你最终的分段线性曲线将通过这些点。
  2. 对于每个点,计算出原始曲线上的切线方程。因为你的图形是凸的,你样本中连续点的切线将在曲线下方相交。
  3. 计算出每组连续切线的交点的x坐标。使用切线方程计算相应的y坐标。

enter image description here

现在,重新排列这些点,就可以得到符合你要求约束的分段线性近似曲线。

enter image description here

h = 0.001;
x = 0.000000001:h:1;
y = abs(log2(x));

% Derivative of function on all the points
der = diff(y)/h;

NPts = 10; % Number of sample points

% Draw the index of the points by which the output will pass at random
% Still make sure you got first and last point
idx = randperm(length(x)-3,NPts-2);
idx = [1 idx+1 length(x)-1]; 
idx = sort(idx);
x_pckd = x(idx);
y_pckd = y(idx);
der_pckd = der(idx);

% Use obscure math to calculate the points of intersection
xder = der_pckd.*x_pckd;
x_2add = -(diff(y_pckd)-(diff(xder)))./diff(der_pckd);
y_2add = der_pckd(1:(end-1)).*(x_2add-(x_pckd(1:(end-1))))+y_pckd(1:(end-1));

% Calculate the error as the sum of the errors made at the middle points
Err_add = sum(abs(y_2add-interp1(x,y,x_2add))); 

% Get final x and y coordinates of interpolant
x_final = [reshape([x_pckd(1:end-1);x_2add],1,[]) x_pckd(end)];
y_final = [reshape([y_pckd(1:end-1);y_2add],1,[]) y_pckd(end)];

figure;
plot(x,y,'-k');
hold on
plot(x_final,y_final,'-or')

在我的代码中,您可以看到这些点是随机绘制的。如果您想进行某种优化(例如,最小化误差的点集是什么),只需运行高数量的次数并跟踪最佳竞争者即可。例如,10000次随机抽取可以看到以下结果:

enter image description here


1
不错!如果您不知道曲线是凸还是凹的,可以寻找二阶导数的零点。这些点是分段线性曲线的一部分。在两个点之间,您可以根据二阶导数的符号使用您的方法或OP中的方法。 - Cris Luengo
1
哦,如果你创建一个分段线性函数,它在输入函数之上,另一个在下面,在相同的x位置有节点,那么你可以将两者平均以得到一个良好的、无偏差的函数近似值! - Cris Luengo
谢谢!除了需要很少的样本点来保证精度外,它也出奇地高效。我没想到它会这么顺利。 - BillBokeey
1
很好的图片,它非常清晰地解释了这个想法。 - Luis Mendo

网页内容由stack overflow 提供, 点击上面的
可以查看英文原文,
原文链接