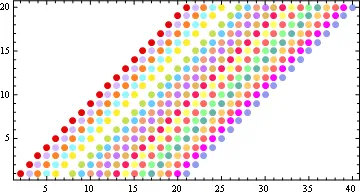
请考虑:
我使用以下代码绘制上述图形,其中
dalist = {{1, 1, 1}, {2, 2, 2}, {3, 3, 3}, {4, 4, 4}, {5, 5, 5},
          {1, 2, 1}, {2, 3, 1}, {3, 4, 1}, {4, 5, 1}, {5, 6, 1}}
我使用以下代码绘制上述图形,其中
#2和#3分别代表x和y坐标。Graphics@MapThread[Point[{#2, #3}] &, Transpose@dalist]

#1是我的数据中想要用来给点着色的时间参考。它可以在1到30之间变化。
#1 = 1应该始终产生相同的颜色。
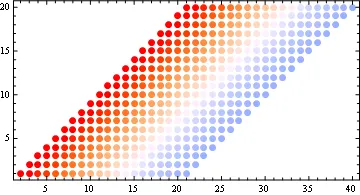
编辑:在下面的解决方案基础上进行改进
- 如何手动设置颜色范围/渐变或使用现有的颜色范围(“BlackBodySpectrum”)?