我有一个带有标签的数据集,我想用点的颜色来表示它们的标签。有没有一种简单的方法可以在绘图中获取当前行数,以便确定该点属于哪个类别?
我知道x,y,z是绘制数据的坐标,但对于外部标签来说没什么用。
这相当丑陋,并且只适用于带有有规律分布的排序数据集。
data = Import["http://ftp.ics.uci.edu/pub/machine-learning-databases/iris/iris.data"];
data = Drop[data, -1]; (*there one extra line at the end*)
inData = data[[All, 1 ;; 4]];
labels = data[[All, 5]];
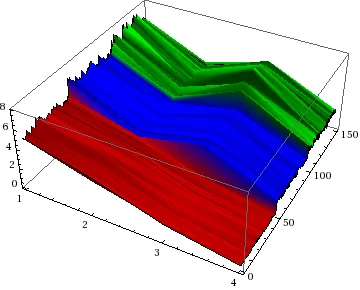
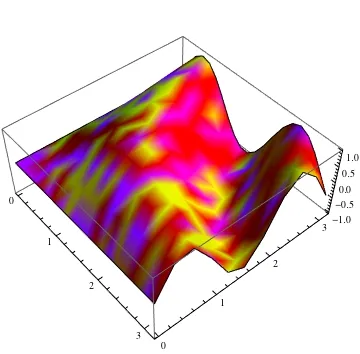
ListPlot3D[inData,
ColorFunction ->
Function[{x, y, z},
If[y < 0.33, RGBColor[1, 1, 0.],
If[y < 0.66, RGBColor[1, 0, 0.], RGBColor[1, 0, 1]]
]
]
]
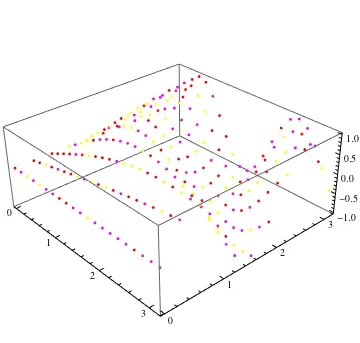
预期结果:
GatherBy可能会有用。 - SzabolcsinData中有四维向量。 - Dr. belisarius