在R中创建形状内的随机点。

8
我正在为一个项目模拟一些数据,基本上我需要画一个不规则的椭圆状形,然后在该形状内生成一堆随机点,但我完全不知道该怎么做。
目前为止,我制作了一条样条曲线,然后在其上绘制了许多点。有没有办法找到重叠部分?或者更好的方法是,在预先制作的形状范围内生成随机点?
(如果有更好的开始方式,请随意放弃我的代码 - 也许它需要成为某种空间对象?)
set.seed(2)
shape <- data.frame(
  x     = c(2, 3, 2, 3, 2, 1, 0, 1),
  y     = c(1, 3, 5, 7, 9, 7, 5, 3 )
)

scatter = data.frame(
  x = rnorm(100, mean = 1.5, sd = .6),
  y = rnorm(100, mean = 5, sd = 2)
)


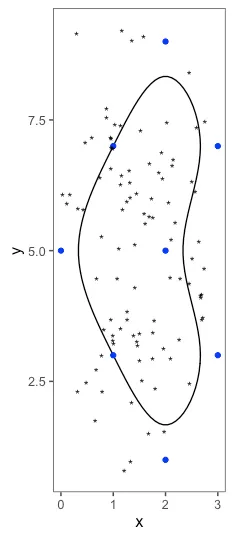
ggplot(data = shape, 
       aes(x=x,y=y)) +
  ggforce::geom_bspline_closed(fill = "transparent", color = "black") +
  geom_point(color = "blue") +
  coord_equal() +  
  geom_point(data = scatter, shape = "*", size=3)

enter image description here


我认为你可以使用
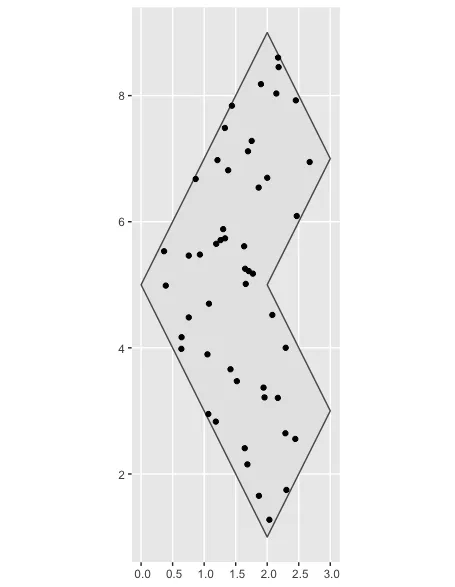
runif创建你的xy数据框,为每个设置最小值和最大值,从而在椭圆内获得更多的样本。具体可参考?runif - Chris
2个回答

9
我建议使用sf包,因为它专门用于空间数据和空间操作。这里是一个生成多边形内随机点的小例子:
library(ggplot2)

polygon =
  # The syntax for creating a polygon with sf is a little strange.
  # It has to be a list of matrices and the first point has to be 
  # repeated as the last point (2, 1).
  list(
    matrix(
      c(2, 1, 3, 3, 2, 5, 3, 7, 2, 9, 1, 7, 0, 5, 1, 3, 2, 1),
      ncol=2, byrow=T
    )
  ) 

# Create an sf polygon
polygon = sf::st_polygon(polygon)
# Sample 50 random points within the polygon
points = sf::st_sample(polygon, size=50)

# Plot using the ggplot geom_sf function.
ggplot() + 
  geom_sf(aes(), data=polygon) + 
  geom_sf(aes(), data=points)

enter image description here

如果您需要点的坐标,只需将sf点对象转换为data.frame,使用points %>% sf::st_coordinates() %>% as.data.frame()即可。


而对于椭圆部分ellipse - Chris

2
在 spatstat 中,多边形被用作点模式的观测窗口。您可以使用这些对象(owin)进行许多几何操作。也许像这样的东西会有用:
library(spatstat)
#> Loading required package: spatstat.data
#> Loading required package: spatstat.geom
#> spatstat.geom 2.2-2.002
#> Loading required package: spatstat.core
#> Loading required package: nlme
#> Loading required package: rpart
#> spatstat.core 2.3-0.003
#> Loading required package: spatstat.linnet
#> spatstat.linnet 2.3-0
#> 
#> spatstat 2.2-0       (nickname: 'That's not important right now') 
#> For an introduction to spatstat, type 'beginner'
W1 <- ellipse(a=5, b=2, centre=c(2,7), phi=80*pi/180)
W2 <- ellipse(a=5, b=2, centre=c(2,3), phi=-80*pi/180)
W <- union.owin(W1, W2)
plot(W, lwd=3, main = "")

Wplus <- dilation(W, 1)
plot(Wplus, lwd=3, main = "")

在窗口内进行点的采样有很多方法(请参见?spatstat中的“创建和操作数据”部分)。例如,可以完全随机或非常均匀地采样:

plot(runifpoint(50, win = Wplus))

plot(rSSI(r = 1, n = 50, win = Wplus))


网页内容由stack overflow 提供, 点击上面的
可以查看英文原文,
原文链接