我想使用ggplot2绘制一个xts对象,但是出现了错误。这是我的做法:
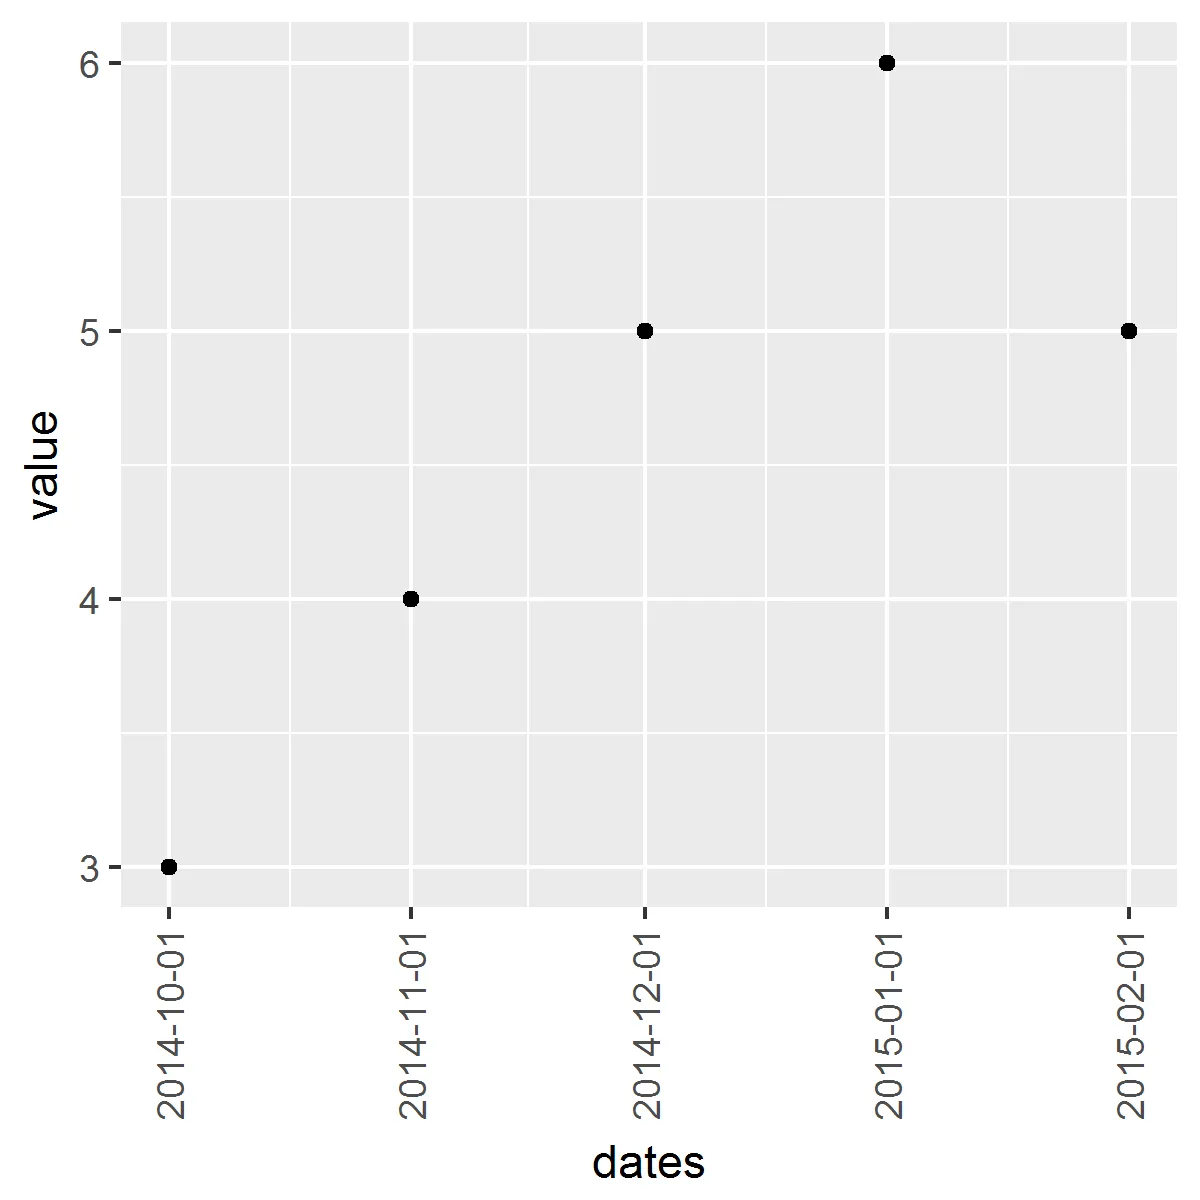
dates <- c("2014-10-01", "2014-11-01", "2014-12-01", "2015-01-01", "2015-02-01")
value <- as.numeric(c(3, 4, 5, 6, 5))
new_df <- data_frame(dates, value)
new_df$dates <- as.Date(dates)
new_df <- as.xts(new_df[,-1], order.by = new_df$dates)
现在我尝试使用ggplot2绘制它:
ggplot(new_df, aes(x = index, y = value)) + geom_point()
我遇到了以下错误:
在 (function (..., row.names = NULL, check.rows = FALSE, check.names = TRUE, : 参数指定的行数不同: 0, 5
我不太确定我做错了什么。
autoplot。 - Samuel