使用geom_boxplot绘制股票蜡烛图时出现问题(R)

9

我正在使用geom_boxplot来使用股票市场数据绘制蜡烛图。问题在于,个别箱线图的上下边缘以及上须端点显示在y轴上比相应值高得多。但每个箱线图的相对高度(上下边缘之间的差异)和下须的末端点都很好。这是我的代码:

candlestickPlot <- function(x){

library("ggplot2")

# x is a data.frame with columns 'date','open','high','low','close'
x$candleLower <- pmin(x$open, x$close)
x$candleUpper <- pmax(x$open, x$close)
x$candleMiddle <- NA
x$fill <- "red"
x$fill[x$open < x$close] = "green"

# Draw the candlesticks
g <- ggplot(x, aes(x=date, lower=candleLower, middle=candleMiddle, upper=candleUpper, ymin=low, ymax=high)) 
g <- g + geom_boxplot(stat='identity', aes(group=date, fill=fill))
g 
}

这里是 x:
    date     close volume  open  high   low
5 2013-12-30 25.82 3525026 27.30 27.76  25.7
4 2013-12-31 27.41 5487204 25.25 27.70 25.25
3 2014-01-02 30.70 7835374 29.25 31.24 29.21
2 2014-01-03 30.12 4577278 31.49 31.80 30.08
1 2014-01-06 30.65 4042724 30.89 31.88 30.37

我这里做错了什么吗?

我复制了你的代码,但它似乎运行得很好。蜡烛图匹配它们的y轴值。也许你可以再次检查一下你手动渲染和读取的数据集是否完全相同? - Alexander Vos de Wael
4个回答

16

有比使用 geom_boxplot 的方法更有效地创建OHLC蜡烛图表的方式,你描述的代码似乎与以下链接中的示例非常相似:http://www.perdomocore.com/2012/using-ggplot-to-make-candlestick-charts-alpha/

似乎许多人在网上发布基于该链接示例使用geom_boxplot的ggplot蜡烛图表示例。但是,使用geom_boxplot绘制会随着所绘制条形数的增加而变得慢。

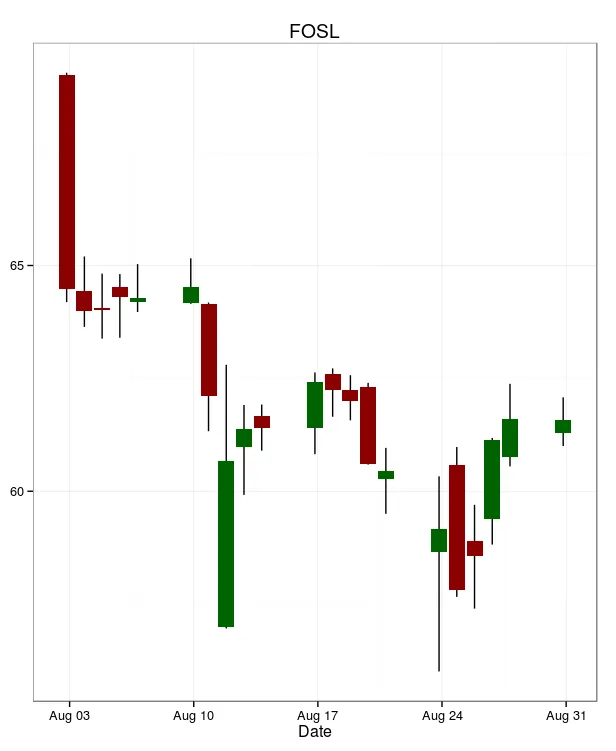
这里是一种在绘制金融数据时使用蜡烛图/OHLC柱更快速的解决方案:

library(ggplot2)
library(quantmod)
FOSL <- getSymbols("FOSL", from="2015-01-01", auto.assign=FALSE)
names(FOSL) <- gsub("^.+\\.","",names(FOSL))  # remove "FOSL." from column names

rng <- "2015-08"
FOSL <- FOSL[rng]
FOSL <- data.frame(Date=as.POSIXct(index(FOSL)), FOSL[,1:4])

FOSL$chg <- ifelse(Cl(FOSL) > Op(FOSL), "up", "dn")
FOSL$width <- as.numeric(periodicity(FOSL)[1])
FOSL$flat_bar <- FOSL[, "High"] == FOSL[, "Low"]

# Candle chart:
pl <- ggplot(FOSL, aes(x=Date))+
  geom_linerange(aes(ymin=Low, ymax=High)) +
  theme_bw() +
  labs(title="FOSL") +
  geom_rect(aes(xmin = Date - width/2 * 0.9, xmax = Date + width/2 * 0.9, ymin = pmin(Open, Close), ymax = pmax(Open, Close), fill = chg)) + guides(fill = FALSE, colour = FALSE) + scale_fill_manual(values = c("dn" = "darkred", "up" = "darkgreen"))

# Handle special case of drawing a flat bar where OHLC = Open:
if (any(FOSL$flat_bar)) pl <- pl + geom_segment(data = FOSL[FOSL$flat_bar,], aes(x = Date - width / 2 * 0.9, y = Close, yend = Close, xend = Date + width / 2 * 0.9))

print(pl)

在此输入图片描述


7
感谢FXQuantTrader介绍了一种漂亮且快速的R蜡烛图条形替代方法!这个方法简洁易读,真是太棒了!下面是改进版的FXQuantTrader解决方案:
- 包装成函数
- 支持更低分辨率(最低到1秒)
- 将蜡烛的须颜色从黑色改为正确的颜色
- 为Close == Open的条添加小水平线
- 为Close == Open的条添加第三种颜色(蓝色)
- 添加“alpha”参数,可以使整个蜡烛图表更加透明,这样当你在上面画出布林带和/或移动平均线时,条形将不会分散注意力(更像是背景)
- 增加一些注释,帮助新手理解代码 :)

以下是改进版的代码:
library(ggplot2)
library(quantmod)
draw_candles <- function(df, title_param, alpha_param = 1){
  df$change <- ifelse(df$Close > df$Open, "up", ifelse(df$Close < df$Open, "down", "flat"))

  # originally the width of the bars was calculated by FXQuantTrader with use of 'periodicity()', which 
  # seems to work ok only with: ‘minute’,‘hourly’, ‘daily’,‘weekly’, ‘monthly’,
  # ‘quarterly’, and ‘yearly’, but can not do 1 sec bars while we want arbitrary bar size support!-)
  # df$width <- as.numeric(periodicity(df)[1])
  # So let us instead find delta (seconds) between 1st and 2nd row and just 
  # use it for all other rows. We check 1st 3 rows to avoid larger "weekend gaps"
  width_candidates <- c(as.numeric(difftime(df$Date[2], df$Date[1]), units = "secs"), 
                        as.numeric(difftime(df$Date[3], df$Date[2]), units = "secs"), 
                        as.numeric(difftime(df$Date[4], df$Date[3]), units = "secs"))

  df$width_s = min(width_candidates)  # one (same) candle width (in seconds) for all the bars

  # define the vector of candle colours either by name or by rgb()
  #candle_colors = c("down" = "red", "up" = "green", "flat" = "blue")
  candle_colors = c("down" = rgb(192,0,0,alpha=255,maxColorValue=255), "up" = rgb(0,192,0,alpha=255,maxColorValue=255), "flat" = rgb(0,0,192,alpha=255,maxColorValue=255))

  # Candle chart:
  g <- ggplot(df, aes(x=Date))+
    geom_linerange(aes(ymin=Low, ymax=High, colour = change), alpha = alpha_param) +  # candle whiskerss (vertical thin lines:)
    theme_bw() +
    labs(title=title_param) +
    geom_rect(aes(xmin = Date - width_s/2 * 0.9, xmax = Date + width_s/2 * 0.9, ymin = pmin(Open, Close), ymax = pmax(Open, Close), fill = change), alpha = alpha_param) +                            # cabdke body
    guides(fill = FALSE, colour = FALSE) +
    scale_color_manual(values = candle_colors) +  # color for line
    scale_fill_manual(values = candle_colors)     # color for candle fill  

    # Handle special cases: flat bar and Open == close:
    if (any(df$change == "flat")) g <- g + geom_segment(data = df[df$change == "flat",], aes(x = Date - width_s / 2 * 0.9, y = Close, yend = Close, xend = Date + width_s / 2 * 0.9, colour = change), alpha = alpha_param)

  #print(g)
  g
}

1
+1 很好。如果您想在图表中绘制“天数”或其他频率,而不带有空白间隔,您可能需要扩展您的函数,就像这里所做的一样(这类似于quantmod中的chart_Serieshttps://dev59.com/p4fca4cB1Zd3GeqPhVbJ?noredirect=1&lq=1 - FXQuantTrader
1
@FXQuantTrader,你提到的SO讨论很有趣!谢谢! 我想隐藏X轴上缺失的日期,但是这会涉及到排序问题,需要使用有序因子进行处理,但是这又可能会在某些日期格式上出现问题。 那么,我们可以考虑使用行号作为X轴,但将其标记为存储在$Date中的日期。但是,这样做比较棘手,需要决定X轴上的刻度应该多久出现一次,并且它们应该看起来美观(例如:第1天和第15天,而不是第3天和第28天)。这些间隙不会影响简单的指标! 我同意抑制间隙会是一个好的选择。你有其他实现方法的想法吗? - Dmitry Shevkoplyas

0

有没有一种方法可以使用Python的ggplot2创建这些蜡烛图? - yoshiserry

0

我创建了一个生成蜡烛图并具有进一步扩展可能性的包。

https://github.com/dominikduda/candlePlotter

来自帮助:

绘制OHLC图表

(...)

参数:

time_series:一个数据框,具有c('Time','Open','High','Low','Close')列,其中Time列必须是POSIXct类型。

chart_title:一个可选的字符串,用作主图标题

under_candles_layers:一个ggplot层的向量,用于在蜡烛下打印

使用的工作示例:

 # Plotting a chart and saving it from a string:

 raw_data <- "
 Time Open High Low Close
 2018-08-30 7050.267 7068.232 6740.648 6985.976
 2018-08-31 6982.225 7075.417 6915.935 7046.783
 2018-09-01 7040.911 7257.571 7030.790 7193.122
 2018-09-02 7203.630 7314.289 7136.561 7277.199
 2018-09-03 7286.205 7334.481 7201.419 7255.241
 2018-09-04 7269.067 7394.179 7251.269 7364.443
 2018-09-05 7365.232 7391.967 6704.715 6704.715
 2018-09-06 6715.508 6715.508 6365.000 6503.564
 2018-09-07 6514.690 6544.672 6378.351 6446.210
 2018-09-08 6426.220 6485.850 6147.691 6203.588
 2018-09-09 6202.271 6417.675 6178.907 6260.216
 2018-09-10 6270.848 6351.214 6263.048 6317.647
 2018-09-11 6320.536 6391.365 6241.453 6289.961
 2018-09-12 6296.140 6349.481 6238.578 6339.010
 2018-09-13 6345.973 6525.523 6337.746 6498.652
 2018-09-14 6488.631 6583.669 6428.993 6492.367
 2018-09-15 6488.870 6561.979 6480.306 6524.671"
 data_for_chart <- read.table(text = raw_data, header = TRUE)
 data_for_chart <- transform(data_for_chart, Time = as.POSIXct(Time))
 plot <- prettyCandlePlot(data_for_chart, 'BTCUSD')

 ggsave(
   'btc_usd_daily.png',
   plot = plot,
   width = 30,
   height = 18,
   units = 'cm'
 )

网页内容由stack overflow 提供, 点击上面的
可以查看英文原文,
原文链接