在ggplot2直方图中图例下面插入一个表格

28

有没有办法让grid.arrange()像split.screen ()一样工作?我想将一个表格安排在图例正下方。

#create histogram
my_hist<-ggplot(diamonds, aes(clarity, fill=cut)) + geom_bar()

#create inset table
my_table<- tableGrob(head(diamonds)[,1:3],gpar.coretext =gpar(fontsize=8),gpar.coltext=gpar(fontsize=8), gpar.rowtext=gpar(fontsize=8))

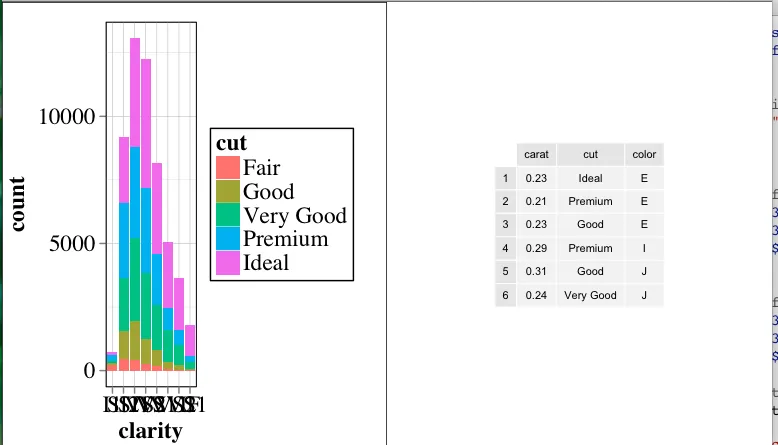
grid.arrange(my_hist,my_table, ncol=2)

生成的图像为:

enter image description here

但我想让它看起来大致像这样:

enter image description here

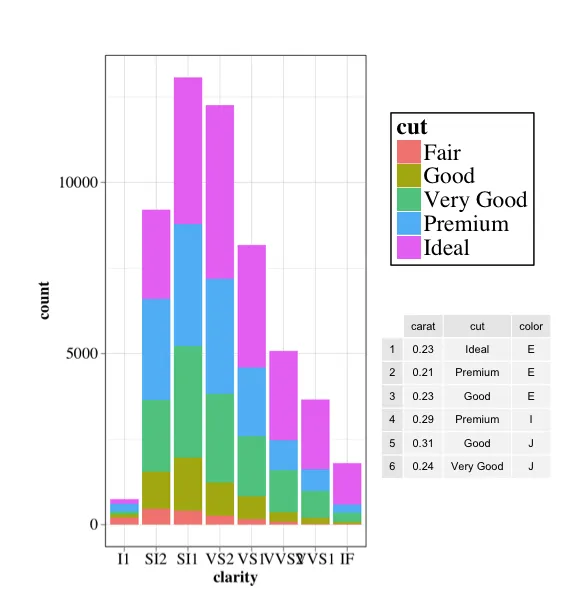
我尝试使用split.screen(),但似乎无法与ggplot类型的图形一起使用。有什么建议吗?谢谢。


请查看此链接:http://learnr.wordpress.com/2009/04/29/ggplot2-labelling-data-series-and-adding-a-data-table/。我之前也需要做同样的事情,不过我不确定这里的代码是否已经过时。 - Simon O'Hanlon
这是一个老问题,如果你想让它们工作,你必须在下面的答案中更改 opts - durum
2个回答

27

Dickoa的回答很简洁。我的回答可以让您更好地控制元素。

my_hist <- ggplot(diamonds, aes(clarity, fill=cut)) + geom_bar()

#create inset table
my_table <- tableGrob(head(diamonds)[,1:3], gpar.coretext = gpar(fontsize=8), gpar.coltext=gpar(fontsize=8), gpar.rowtext=gpar(fontsize=8))

#Extract Legend
g_legend <- function(a.gplot){
  tmp <- ggplot_gtable(ggplot_build(a.gplot))
  leg <- which(sapply(tmp$grobs, function(x) x$name) == "guide-box")
  legend <- tmp$grobs[[leg]]
  return(legend)}

legend <- g_legend(my_hist)

#Create the viewports, push them, draw and go up
grid.newpage()
vp1 <- viewport(width = 0.75, height = 1, x = 0.375, y = .5)
vpleg <- viewport(width = 0.25, height = 0.5, x = 0.85, y = 0.75)
subvp <- viewport(width = 0.3, height = 0.3, x = 0.85, y = 0.25)
print(my_hist + opts(legend.position = "none"), vp = vp1)
upViewport(0)
pushViewport(vpleg)
grid.draw(legend)
#Make the new viewport active and draw
upViewport(0)
pushViewport(subvp)
grid.draw(my_table)

输入图像描述


15

首先,您应该查看此Wiki,其中有许多示例(请查看arrangeGrob示例)。

因此,使用这些示例,我成功地得出了以下解决方案:

require(gridExtra)
require(ggplot2)

## original graph
my_hist <- ggplot(diamonds, aes(clarity, fill=cut)) + geom_bar()

## get the legend 
tmp <- ggplot_gtable(ggplot_build(my_hist))
leg <- which(sapply(tmp$grobs, function(x) x$name) ==  "guide-box")
legend <- tmp$grobs[[leg]]

## create inset table
my_table <- tableGrob(head(diamonds)[,1:3],gpar.coretext =gpar(fontsize=8),gpar.coltext=gpar(fontsize=8), gpar.rowtext=gpar(fontsize=8))


### final result 
grid.arrange(my_hist + opts(legend.position = "none"), arrangeGrob(legend, my_table), ncol = 2)

输入图像描述


维基链接已失效。 - ZN13
@PajeetRamahari-Mawari-Kulmini 非常感谢,这真的很有帮助。我已经更新了链接。 - dickoa

网页内容由stack overflow 提供, 点击上面的
可以查看英文原文,
原文链接