如果我对我的多元数据进行马氏距离的多元qq图,并将其绘制在卡方分布上,那么我希望伴随的qq线是一条截距为0,斜率为1的直线。但如果我运行以下代码:
scores<-matrix(rnorm(100*3),nc=3)
mah_scores = mahalanobis(scores,center=colMeans(scores),cov=cov(scores))
chi_scores = qchisq(ppoints(nrow(scores)),df=3)
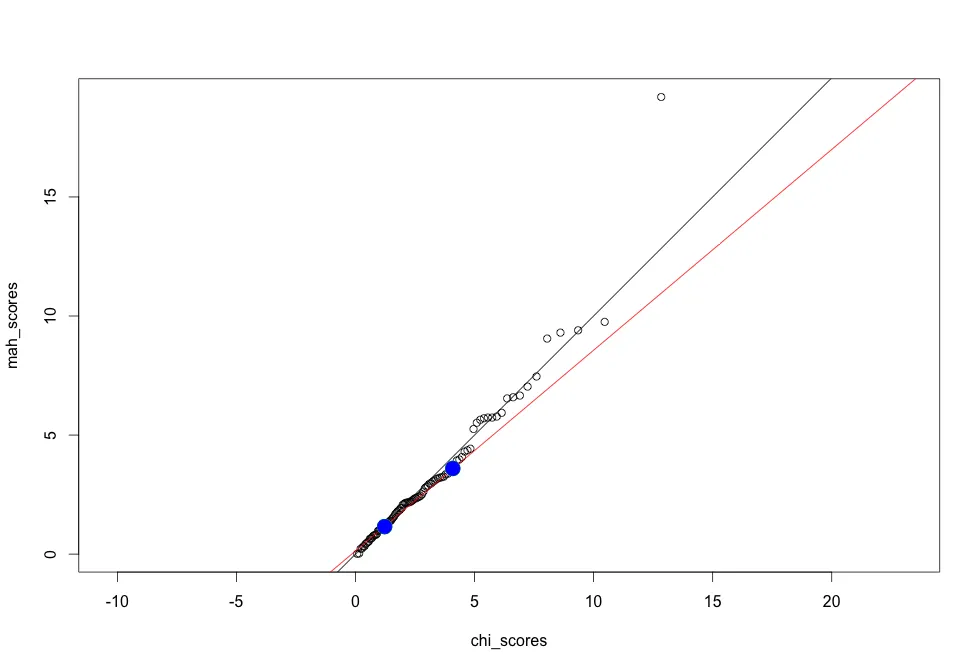
qqplot(x=chi_scores,y=mah_scores,asp=1)
abline(a=0,b=1)
qqline(mah_scores, distribution = function(p) qchisq(p,df = 3),col="red")
我得到了以下图表:
(我正在运行R版本2.15.3(2013-03-01))