我希望能在一张图片上绘制多条曲线。
使用下面的代码,我已经接近目标了:
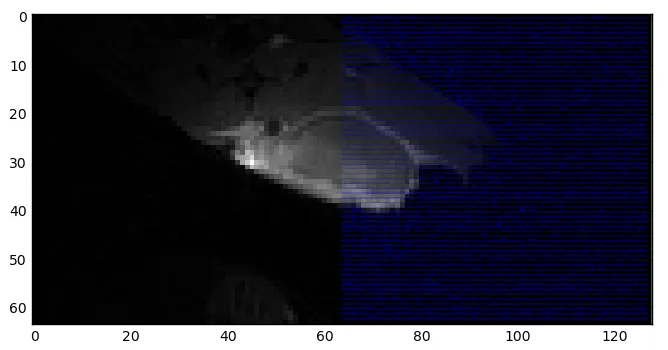
我得到的结果看起来像这样: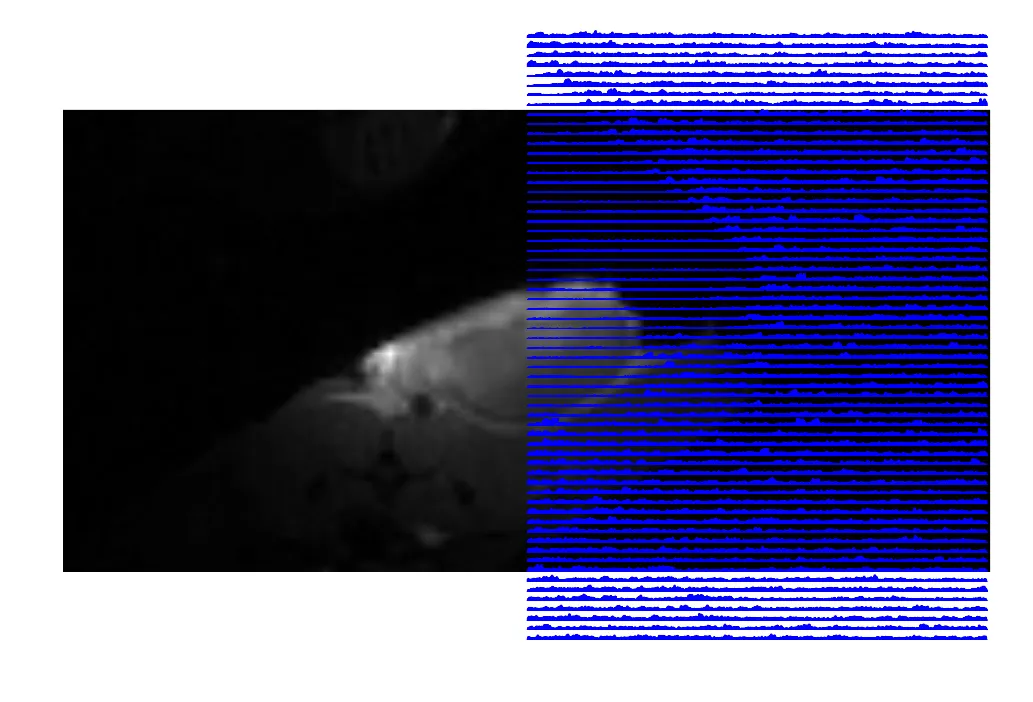 问题是,虽然我似乎能够在水平(x)方向上摆脱所有填充,但在垂直方向上,图像和堆叠的图中有不同数量的填充。
我尝试使用
G=plt.matplotlib.gridspec.GridSpec(64,1)
fig = plt.figure()
plt.imshow(img.data[:,:],cmap='gray')
plt.axis('off')
plt.axis([0,128,0,64])
for i in arange(64):
    fig.add_subplot(G[i,0])
    plt.axis('off')
    # note that vtc.data.shape = (64, 128*400=51200)
    # so every trace for each image pixel is 400 points long
    plt.plot(vtc.data[i,:])
    plt.axis([0, 51200, 0, 5])
我得到的结果看起来像这样:
问题是,虽然我似乎能够在水平(x)方向上摆脱所有填充,但在垂直方向上,图像和堆叠的图中有不同数量的填充。我尝试使用
ax = plt.gca()
ax.autoscale_view('tight')
但这也没有减少边距。
我如何让一个m x n的线图网格与尺寸为(fm)-by-(fn)的图像(经过因子f放大)精确对齐?
更新和解决方案: @RutgerKassies的答案效果很好。我使用他的代码实现了这一点:
fig, axs = plt.subplots(1,1,figsize=(8,4))
axs.imshow(img.data[:,:],cmap='gray', interpolation='none')
nplots = 64
fig.canvas.draw()
box = axs._position.bounds
height = box[3] / nplots
for i in arange(nplots):
    tmpax = fig.add_axes([box[0], box[1] + i * height, box[2], height])
    tmpax.set_axis_off()
    # make sure to get image orientation right and
    tmpax.plot(vtc.data[nplots-i-1,:],alpha=.3)
    tmpax.set_ylim(0,5)
    tmpax.set_xlim(0, 51200)