如何使子图的大小相等

3
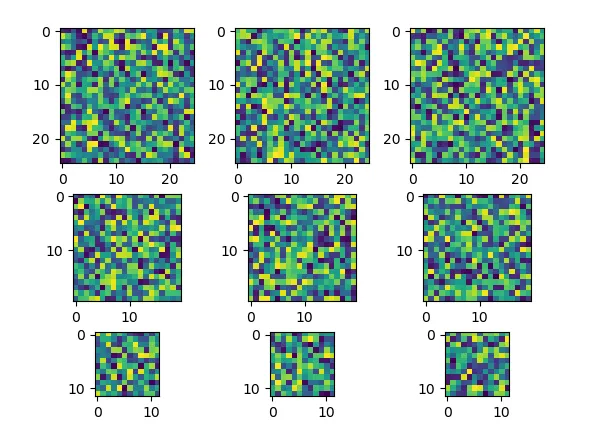
我正在使用matplotlib和GridSpec在3x3子图中绘制9张图片。
    fig = plt.figure(figsize=(30,40))
    fig.patch.set_facecolor('white')
    gs1 = gridspec.GridSpec(3,3)
    gs1.update(wspace=0.05, hspace=0.05)
    ax1 = plt.subplot(gs1[0])
    ax2 = plt.subplot(gs1[1])
    ax3 = plt.subplot(gs1[2])
    ax4 = plt.subplot(gs1[3])
    ax5 = plt.subplot(gs1[4])
    ax6 = plt.subplot(gs1[5])
    ax7 = plt.subplot(gs1[6])
    ax8 = plt.subplot(gs1[7])
    ax9 = plt.subplot(gs1[8])
    ax1.imshow(img1,cmap='gray')
    ax2.imshow(img2,cmap='gray')
    ...
    ax9.imshow(img9,cmap='gray')
          

然而,每一行的图像尺寸都不同。例如,第一行的图像尺寸为256x256,第二行的图像尺寸为200x200,第三行的图像尺寸为128x128。
我想在子图中绘制具有相同尺寸的图像。在Python中应该如何使用它?
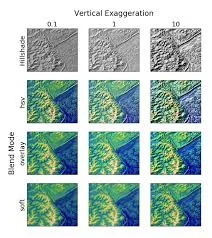
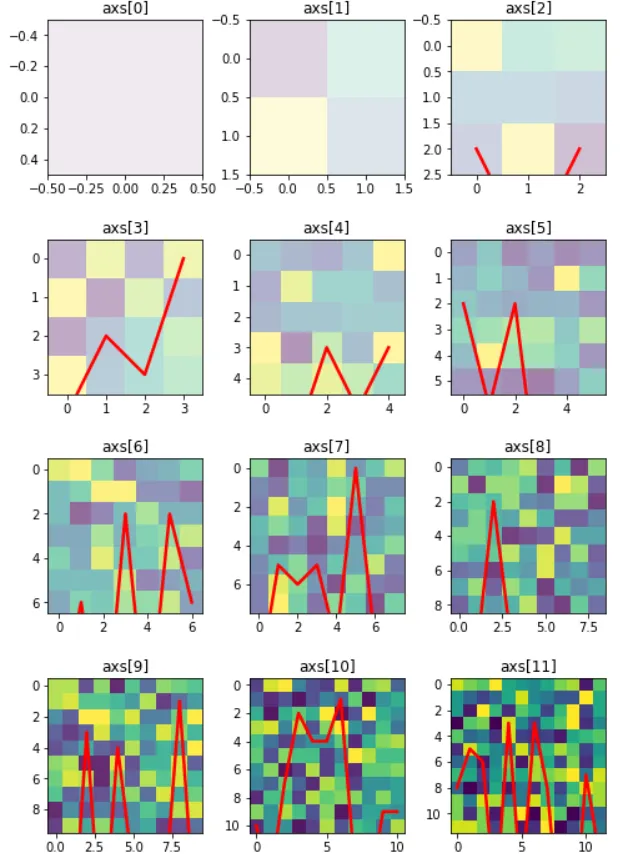
这是一个4x3子图的示例。

enter image description here


看看这个链接是否有帮助:https://dev59.com/BGYr5IYBdhLWcg3wYpUg - user11174078
2个回答

3
不要使用`matplotlib.gridspec`,而要像下面的可运行代码所示那样使用`figure.add_subplot`。但是,在进行一些绘图时,您需要使用`set_autoscale_on(False)`来抑制其自动调整大小的行为。
import numpy as np
import matplotlib.pyplot as plt

# a function that creates image array for `imshow()`
def make_img(h):
    return np.random.randint(16, size=(h,h)) 

fig = plt.figure(figsize=(8, 12))
columns = 3
rows = 4
axs = []

for i in range(columns*rows):
    axs.append( fig.add_subplot(rows, columns, i+1) )

    # axs[-1] is the new axes, write its title as `axs[number]`
    axs[-1].set_title("axs[%d]" % (i))

    # plot raster image on this axes
    plt.imshow(make_img(i+1), cmap='viridis', alpha=(i+1.)/(rows*columns))

    # maniputate axs[-1] here, plot something on it
    axs[-1].set_autoscale_on(False)   # suppress auto sizing
    axs[-1].plot(np.random.randint(2*(i+1), size=(i+1)), color="red", linewidth=2.5)


fig.subplots_adjust(wspace=0.3, hspace=0.4)
plt.show()

生成的图表:

enter image description here


2
我想你想展示不同尺寸的图像,以使不同图像的所有像素大小相等。
这通常很困难,但是如果子图网格中一行(或一列)中的所有图像都是相同大小的情况下,它变得容易。可以使用gridspec的height_ratios(或在列的情况下使用width_ratios)参数,并将其设置为图像的像素高度(宽度)。
import matplotlib.pyplot as plt
import numpy as np

images = [np.random.rand(r,r) for r in [25,20,12] for _ in range(3)]


r = [im.shape[0] for im in images[::3]]
fig, axes = plt.subplots(3,3, gridspec_kw=dict(height_ratios=r, hspace=0.3))

for ax, im in zip(axes.flat, images):
    ax.imshow(im)


plt.show()

enter image description here


抱歉。我有9张大小不同的图像。如何绘制到3x3子图中,使子图的大小相同。对于误解感到抱歉。 - Jame

网页内容由stack overflow 提供, 点击上面的
可以查看英文原文,
原文链接