请您好,我认为我的问题很简单,但我找不到任何有用的博客来展示如何实现。我有一个名为“series”的Python Pandas系列,并使用series.hist()来可视化直方图。我需要在图表上直接可视化每个bin的出现次数,但我找不到解决方法。
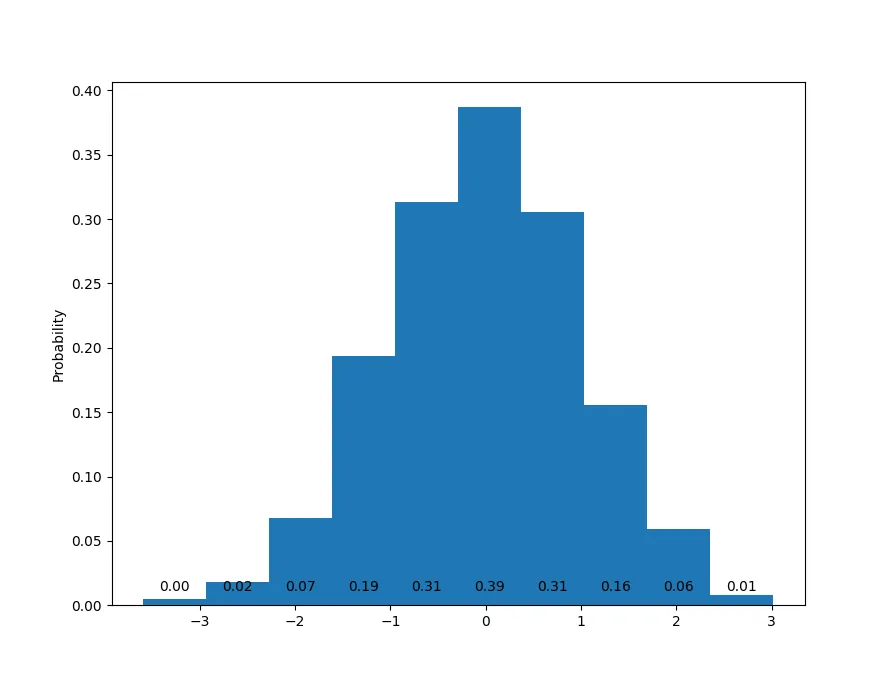
我该如何在每个bin上面看到显示每个bin的出现次数的标签呢?
要确切,请看我的代码:
import matplotlib.pyplot as plt
your_bins=10
data = [df_5m_9_4pm.loc['2017-6']['sum_daily_cum_ret'].values]
plt.hist(data, binds = your_bins)
arr = plt.hist(data,bins = your_bins)
for i in range(your_bins):
    plt.text(arr[1][i],arr[0][i],str(arr[0][i]))
如果我只是打印变量"data",它的样子就像这样:
[array([ 0.        ,  0.03099187, -0.00417244, ..., -0.00459067,
         0.0529476 , -0.0076605 ])]
如果我运行上述代码,会出现错误消息:
---------------------------------------------------------------------------
ValueError                                Traceback (most recent call last)
<ipython-input-97-917078981b1d> in <module>()
      2 your_bins=10
      3 data = [df_5m_9_4pm.loc['2017-6']['sum_daily_cum_ret'].values]
----> 4 plt.hist(data, binds = your_bins)
      5 arr = plt.hist(data,bins = your_bins)
      6 for i in range(your_bins):

~/anaconda3/lib/python3.6/site-packages/matplotlib/pyplot.py in hist(x, bins, range, density, weights, cumulative, bottom, histtype, align, orientation, rwidth, log, color, label, stacked, normed, hold, data, **kwargs)
   3002                       histtype=histtype, align=align, orientation=orientation,
   3003                       rwidth=rwidth, log=log, color=color, label=label,
-> 3004                       stacked=stacked, normed=normed, data=data, **kwargs)
   3005     finally:
   3006         ax._hold = washold

~/anaconda3/lib/python3.6/site-packages/matplotlib/__init__.py in inner(ax, *args, **kwargs)
   1708                     warnings.warn(msg % (label_namer, func.__name__),
   1709                                   RuntimeWarning, stacklevel=2)
-> 1710             return func(ax, *args, **kwargs)
   1711         pre_doc = inner.__doc__
   1712         if pre_doc is None:

~/anaconda3/lib/python3.6/site-packages/matplotlib/axes/_axes.py in hist(***failed resolving arguments***)
   6205             # this will automatically overwrite bins,
   6206             # so that each histogram uses the same bins
-> 6207             m, bins = np.histogram(x[i], bins, weights=w[i], **hist_kwargs)
   6208             m = m.astype(float)  # causes problems later if it's an int
   6209             if mlast is None:

~/anaconda3/lib/python3.6/site-packages/numpy/lib/function_base.py in histogram(a, bins, range, normed, weights, density)
    665     if mn > mx:
    666         raise ValueError(
--> 667             'max must be larger than min in range parameter.')
    668     if not np.all(np.isfinite([mn, mx])):
    669         raise ValueError(

ValueError: max must be larger than min in range parameter.
data打印来看,似乎您已经将数据封装在一个列表中 - 因此,您正在传递一个数组的列表而不是值的数组。请尝试改为plt.hist(data[0], bins = your_bins)。或者更好的方法是在分配data时删除括号。 - Patrick O'Connor