如何使用ggplot2、reshape2和Hmisc在R中制作三角形热力图?

4
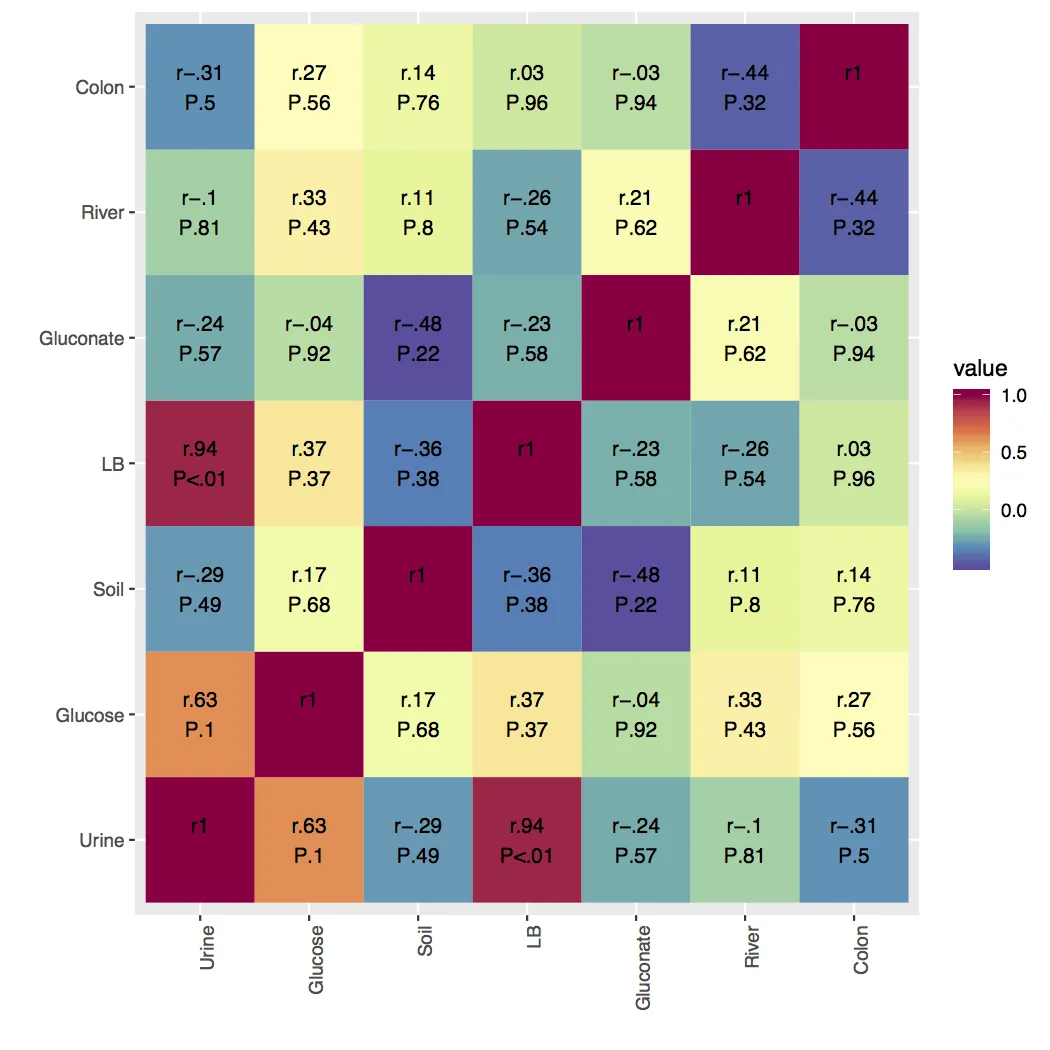
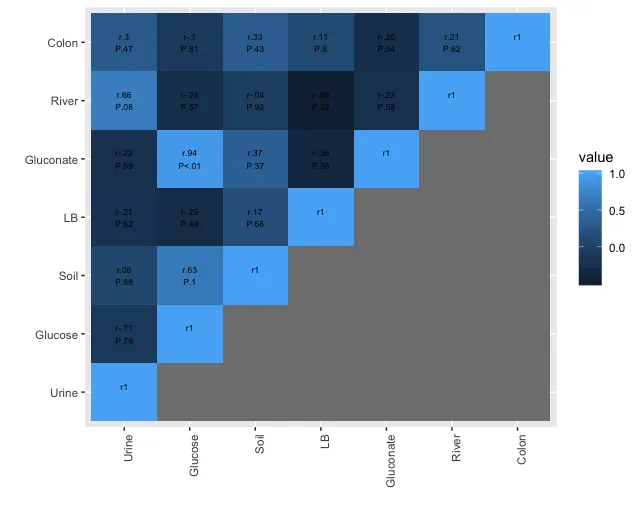
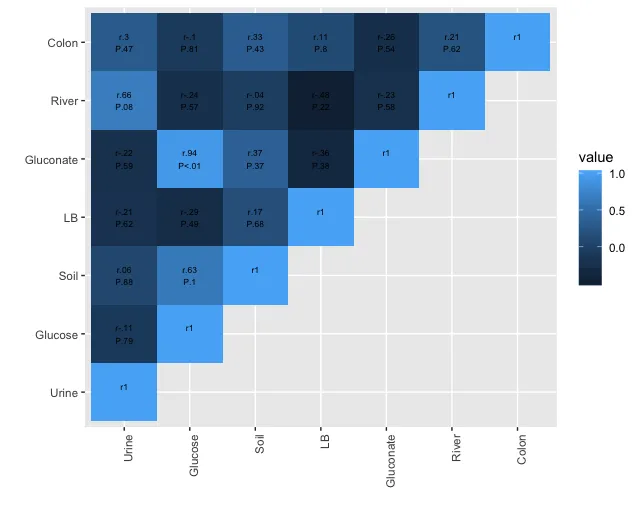
我需要帮助在R中使用ggplot2,reshape2和Hmisc制作一个三角热度图,因为我需要在图表中显示r和P值。
我尝试在许多地方插入cordata[lower.tri(c),],但没有帮助。我也尝试了不同的方法,但它们没有显示出我需要的p值和rho值!我尝试在这里和谷歌上搜索“Hmisc+triangle+heatmap”,但找不到任何有效的方法。
以下是原始数据,从excel表格导入: df
# A tibble: 8 x 7
     Urine   Glucose    Soil         LB Gluconate   River    Colon
     <dbl>     <dbl>   <dbl>      <dbl>     <dbl>   <dbl>    <dbl>
1  3222500 377750000 7847250  410000000   3252500 3900000 29800000
2  3667500 187000000 3937500  612000000   5250000 4057500 11075000
3  8362500 196250000 6207500  491000000   2417500 2185000  9725000
4 75700000 513000000 2909750 1415000000   3990000 3405000       NA
5  4485000 141250000 7241000  658750000   3742500 3470000  6695000
6  1947500 235000000 3277500  528500000   7045000 1897500 25475000
7  4130000 202500000  111475  442750000   6142500 4590000  4590000
8  1957500 446250000 8250000  233250000   5832500 5320000  5320000

代码:

library(readxl)
data1 <- read_excel("./pca-mean-data.xlsx", sheet = 1)
df <- data1[c(2,3,4,5,6,7,8,9,10,11)]
library(ggplot2)
library(reshape2)
library(Hmisc)
library(stats)
library(RColorBrewer)

abbreviateSTR <- function(value, prefix){  # format string more concisely
  lst = c()
  for (item in value) {
    if (is.nan(item) || is.na(item)) { # if item is NaN return empty string
      lst <- c(lst, '')
      next
    }
    item <- round(item, 2) # round to two digits
    if (item == 0) { # if rounding results in 0 clarify
      item = '<.01'
    }
    item <- as.character(item)
    item <- sub("(^[0])+", "", item)    # remove leading 0: 0.05 -> .05
    item <- sub("(^-[0])+", "-", item)  # remove leading -0: -0.05 -> -.05
    lst <- c(lst, paste(prefix, item, sep = ""))
  }
  return(lst)
}

d <- df

cormatrix = rcorr(as.matrix(d), type='pearson')
cordata = melt(cormatrix$r)
cordata$labelr = abbreviateSTR(melt(cormatrix$r)$value, 'r')
cordata$labelP = abbreviateSTR(melt(cormatrix$P)$value, 'P')
cordata$label = paste(cordata$labelr, "\n", 
                      cordata$labelP, sep = "")


hm.palette <- colorRampPalette(rev(brewer.pal(11, 'Spectral')), space='Lab')

txtsize <- par('din')[2] / 2
pdf(paste("heatmap-MEANDATA-pearson.pdf",sep=""))
ggplot(cordata, aes(x=Var1, y=Var2, fill=value)) + geom_tile() + 
  theme(axis.text.x = element_text(angle=90, hjust=TRUE)) +
  xlab("") + ylab("") + 
  geom_text(label=cordata$label, size=txtsize) + 
  scale_fill_gradient(colours = hm.palette(100))

dev.off()

我附上了一个示例图,我只需要把它分成两半!如果你能帮忙,我会非常感激!

热力图示例,请查看链接!

2个回答

6
这里有一种使用一些 dplyr 函数进行数据重塑和过滤的方法。在制作相关矩阵后,我正在同时 melt df_cor$rdf_cor$P 并将它们连接起来,使这些数据框更加简洁(和安全),然后再制作标签。
然后我给每行一个成对的ID,这是将 Var1Var2 的组合粘贴在一起并排序后的版本。因为我对其进行了排序,所以 (Urine, Soil) 和 (Soil, Urine) 的行将具有相同的ID,而不考虑哪个是 Var1,哪个是 Var2。然后,通过此ID进行分组,我采用唯一观察值,使用ID作为选择重复项的唯一标准。下面是该长形数据的前几行。
library(tidyverse)
library(Hmisc)
library(reshape2)

# ... function & df definitions removed

df_cor <- rcorr(as.matrix(df), type = "pearson")

df_long <- inner_join(
  melt(df_cor$r, value.name = "r"),
  melt(df_cor$P, value.name = "p"),
  by = c("Var1", "Var2")
) %>%
  mutate(r_lab = abbreviateSTR(r, "r"), p_lab = abbreviateSTR(p, "P")) %>%
  mutate(label = paste(r_lab, p_lab, sep = "\n")) %>%
  rowwise() %>%
  mutate(pair = sort(c(Var1, Var2)) %>% paste(collapse = ",")) %>%
  group_by(pair) %>%
  distinct(pair, .keep_all = T)

head(df_long)
#> # A tibble: 6 x 8
#> # Groups:   pair [6]
#>   Var1      Var2       r         p r_lab p_lab label         pair 
#>   <fct>     <fct>  <dbl>     <dbl> <chr> <chr> <chr>         <chr>
#> 1 Urine     Urine  1     NA        r1    ""    "r1\n"        1,1  
#> 2 Glucose   Urine  0.627  0.0963   r.63  P.1   "r.63\nP.1"   1,2  
#> 3 Soil      Urine -0.288  0.489    r-.29 P.49  "r-.29\nP.49" 1,3  
#> 4 LB        Urine  0.936  0.000634 r.94  P<.01 "r.94\nP<.01" 1,4  
#> 5 Gluconate Urine -0.239  0.569    r-.24 P.57  "r-.24\nP.57" 1,5  
#> 6 River     Urine -0.102  0.811    r-.1  P.81  "r-.1\nP.81"  1,6

制图非常简单。我使用了minimal主题,这样就不会显示矩阵的上半部分是空白的,并关闭了网格,因为它在这里没有太多意义。

ggplot(df_long, aes(x = Var1, y = Var2, fill = r)) +
  geom_raster() +
  geom_text(aes(label = label)) +
  scale_fill_distiller(palette = "Spectral") +
  theme_minimal() +
  theme(panel.grid = element_blank())

这是在2018年08月05日由 reprex包 (v0.2.0)创建的。


非常感谢您的帮助!!!这个方法行得通!尽管 geom_raster 无法与 Preview 一起使用,但我使用了 geom_tile。再次感谢!! - leah73
你能检查一下这里的相关问题吗?(点击链接:https://dev59.com/CcXsa4cB1Zd3GeqPSR5v) - Mario

4
我相信有更加动态的方法来实现这个,但我只是硬编码了你不想要的东西。
cordata %>%
    arrange(Var1) %>%
    mutate_at(vars(value, label), funs(
        ifelse(row_number() > 1 & Var2 == "Urine" |
               row_number() > 9 & Var2 == "Glucose"|
               row_number() > 17 & Var2 == "Soil" |
               row_number() > 25 & Var2 == "LB" |
               row_number() > 33 & Var2 == "Gluconate" |
               row_number() > 41 & Var2 == "River", NA, .))) %>% 
    ggplot(aes(x=Var1, y=Var2, fill=value)) + 
    geom_tile()+
    theme(axis.text.x = element_text(angle=90, hjust=TRUE))+
    xlab("") + 
    ylab("") +
    geom_text(aes(label=label), size=txtsize)

enter image description here

由于某些原因,我无法在我的电脑上使用您的颜色方案。我会再考虑一下,看看能否使其更加动态。
编辑:
我有另一个想法,这个想法效果要好得多。我会保留旧的方案以供参考。
cordata %>% 
    arrange(Var1) %>%
    group_by(Var1) %>%
    filter(row_number() >= which(Var1 == Var2)) %>%
    ggplot(aes(x=Var1, y=Var2, fill=value)) + 
    geom_tile() +
    theme(axis.text.x = element_text(angle=90, hjust=TRUE)) +
    xlab("") + 
    ylab("") +
    geom_text(aes(label=label), size=txtsize)

enter image description here

我在这里做的是说,我想按组筛选出所有低于Var1 = Var2位置的数据。这实际上删除了地图的下半部分,而第一种方法只将特定变量行更改为NA。

请您在此处查看相关问题:https://dev59.com/CcXsa4cB1Zd3GeqPSR5v - Mario

网页内容由stack overflow 提供, 点击上面的
可以查看英文原文,
原文链接