gnuplot:使用字符组合制作热力图

3

我目前正在分析文本中的两个字符组合,并希望使用gnuplot将频率可视化为热图。我的输入文件格式如下(COUNT表示此组合的实际数量)

a a COUNT
a b COUNT
...
z y COUNT
z z COUNT

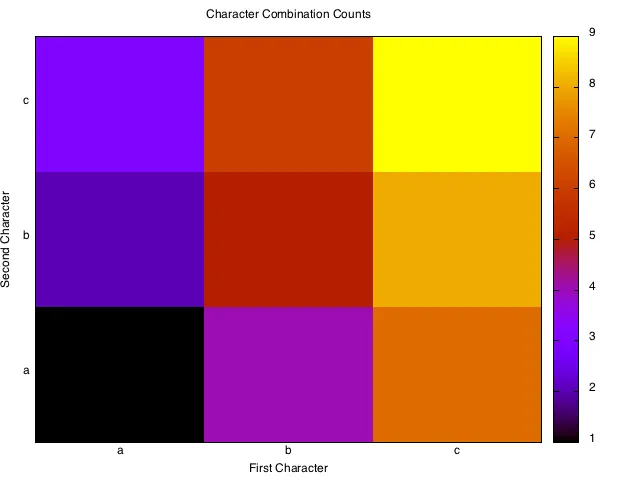
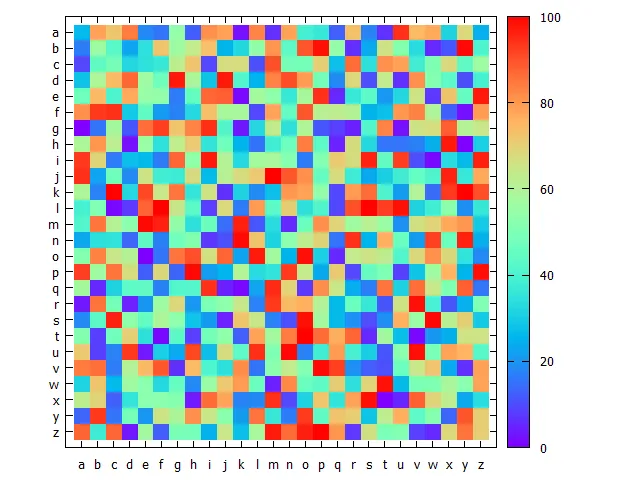
现在我想创建一个热力图(类似于此网站上显示的第一个热力图)。在x轴和y轴上,我希望显示从A到Z的字符。

a
b
...
z
     a b ... z

我对gnuplot不太熟悉,所以我尝试使用plot "input.dat" using 2:1:3 with images,结果出现错误信息“无法使用空的x范围进行绘图”。我的天真想法是运行set xrange ['a':'z'],但没有帮助。

网站上有很多相关问题,但它们要么涉及数值x值(例如非均匀网格上的Gnuplot热图),要么涉及不同的输入数据格式(例如gnuplot:使用行和列名称标记矩阵(热图)的x和y轴

所以我的问题是:将我的输入文件转换为漂亮的gnuplot热图的最简单方法是什么?

2个回答

4
你需要将字母字符转换为整数。在gnuplot中可能有办法做到这一点,但可能会很麻烦。
我的解决方案是使用一个快速的Python脚本来转换数据文件(假设它叫做“data.dat”):
#!/usr/bin/env python2.7

with open('data.dat', 'r') as i:
    with open('data2.dat', 'w') as o:
        lines = i.readlines()
        for line in lines:
            line = line.split()
            x = str(ord(line[0].lower()) - ord('a'))
            y = str(ord(line[1].lower()) - ord('a'))
            o.write("%s %s %s\n" % (x, y, line[2]))

这需要一个像这样的文件:

a a 1
a b 2
a c 3
b a 4
b b 5
b c 6
c a 7
c b 8
c c 9

并将其转换为:
0 0 1
0 1 2
0 2 3
1 0 4
1 1 5
1 2 6
2 0 7
2 1 8
2 2 9

然后你可以在gnuplot中绘制它:

#!/usr/bin/env gnuplot

set terminal pngcairo
set output 'test.png'

set xtics ("a" 0, "b" 1, "c" 2)
set ytics ("a" 0, "b" 1, "c" 2)

set xlabel 'First Character'
set ylabel 'Second Character'

set title 'Character Combination Counts'

plot 'data2.dat' with image

手动设置刻度有点繁琐,但是这样做可以正常工作。

enter image description here


谢谢!当我使用您的转换器时,我发现我的输入组合中缺少没有出现的组合,这导致热图无法正确显示。因此,我稍微扩展了您的脚本,现在一切都很好:https://gist.github.com/moee/7860083(请注意:我对Python不是很熟悉,所以我的代码可能有点凌乱) - Michael Osl

1

编辑: 修改了代码,更好地符合原问题。

你的问题基本上可以归结为:gnuplot 中是否有一个 ord() 函数?答案:没有,但是你可以自己构建它,而不需要调用外部脚本。"ASCII-Trick" 是从这里取得的:how can I find out the ASCII code of a character in gnuplot

以下示例适用于 gnuplot>=4.6.0(OP提问时的版本)。

代码:

### plotting heatmap from "alphabetical data"
reset

# definition of chr() and ord()
chr(n) = sprintf('%c',n)
ASCII = ''; do for [i=1:255] {ASCII = ASCII.chr(i)}
ord(c) = strstrt(ASCII,c)

FILE = "SO20428010.dat"
# create some random test data
set print FILE
    do for [i=1:26] for [j=1:26] {
        print sprintf("%s %s %d", chr(i+96), chr(j+96), int(rand(0)*101))
    }
set print

set size square
set xrange[0:27]
set yrange[27:0] reverse
set key noautotitle
set palette rgb 33,13,10

ChrToInt(col) = ord(strcol(col))-96

plot FILE u (ChrToInt(1)):(ChrToInt(2)):3:xtic(1):ytic(2) w image
### end of code

Result:

enter image description here


网页内容由stack overflow 提供, 点击上面的
可以查看英文原文,
原文链接