在 ggpairs (GGally) 中操作轴标题

17

我正在使用下面的代码来生成以下图表。

# Setup
data(airquality)

# Device start
png(filename = "example.png", units = "cm", width = 20, height = 14, res = 300)

# Define chart
pairs.chrt <- ggpairs(airquality,
                      lower = list(continuous = "smooth"),
                      diag = list(continuous = "blank"),
                      upper = list(continuous = "blank")) +
  theme(legend.position = "none",
        panel.grid.major = element_blank(),
        axis.ticks = element_blank(),
        axis.title.x = element_text(angle = 180, vjust = 1, color = "black"),
        panel.border = element_rect(fill = NA))

# Device off and print
print(pairs.chrt)
dev.off()

ggpairs - First Example

我正在尝试修改轴标题的显示方式,特别是希望轴标题:

  1. 距离轴标签更远
  2. 倾斜一定角度

例如,我想获得类似于下面图片所示的轴标题(我只对轴标签感兴趣,不关心图表其他部分): Example Label Placement 图片来自:Geovisualist

我尝试通过更改axis.title.x的值来调整语法,但它没有产生期望的结果。例如使用angle = 45运行代码。

axis.title.x = element_text(angle = 45, vjust = 1, color = "black"),
            panel.border = element_rect(fill = NA))

返回相同的图表。例如,通过更改axis.text.x可以控制轴标签,但是我找不到如何控制此绘图中的轴标题的答案。任何帮助将不胜感激。

3个回答

14

简短的回答:似乎没有一种优雅或简单的方法来实现它,但是这里有一个变通方法。

我深入研究了 ggpairs 的源代码(在 CRAN 提供的 GGally 包源代码中),看看变量标签是如何实际绘制的。在 ggpairs.R 中相关的函数是 print.ggpairs。结果表明,变量标签不是绘图矩阵中每个单元格中 ggplot 对象的一部分——即它们不是轴标题,这就是为什么使用 theme(axis.title.x = element_text(angle = 45) 等时不会受到影响。

相反,它们似乎是使用 grid.text(在包 'grid' 中)作为文本注释进行绘制的。 grid.text 接受参数,包括 x、y、hjust、vjust、rot(其中 rot 是旋转角度),以及使用 gpar 的字体大小、字体系列等等(请参阅 ?grid.text),但目前似乎没有办法向 print.ggpairs 中传入这些参数的不同值——它们被固定为默认值。

您可以通过最初留空变量标签,然后使用修改过的 print.ggpairs 代码的相关部分进行自定义的放置、旋转和样式添加标签。我想出了以下修改。(顺便说一下,因为原始的 GGally 源代码是根据GPL-3 许可证发布的,所以这个修改也是如此。)

customize.labels <- function(
  plotObj,
  varLabels = NULL, #vector of variable labels
  titleLabel = NULL, #string for title
  leftWidthProportion = 0.2, #if you changed these from default...
  bottomHeightProportion = 0.1, #when calling print(plotObj),...
  spacingProportion = 0.03, #then change them the same way here so labels will line up with plot matrix.
  left.opts = NULL, #see pattern in left.opts.default
  bottom.opts = NULL, #see pattern in bottom.opts.default
  title.opts = NULL) { #see pattern in title.opts.default

  require('grid')

  vplayout <- function(x, y) {
    viewport(layout.pos.row = x, layout.pos.col = y)
  }

  numCol <- length(plotObj$columns)
  if (is.null(varLabels)) {
    varLabels <- colnames(plotObj$data)
    #default to using the column names of the data
  } else if (length(varLabels) != numCol){
    stop('Length of varLabels must be equal to the number of columns')
  }

  #set defaults for left margin label style
  left.opts.default <- list(x=0,
                            y=0.5,
                            rot=90,
                            just=c('centre', 'centre'), #first gives horizontal justification, second gives vertical
                            gp=list(fontsize=get.gpar('fontsize')))
  #set defaults for bottom margin label style
  bottom.opts.default <- list(x=0,
                              y=0.5,
                              rot=0,
                              just=c('centre', 'centre'),#first gives horizontal justification, second gives vertical
                              gp=list(fontsize=get.gpar('fontsize')))
  #set defaults for title text style
  title.opts.default <- list(x = 0.5, 
                             y = 1, 
                             just = c(.5,1),
                             gp=list(fontsize=15))

  #if opts not provided, go with defaults
  if (is.null(left.opts)) {
    left.opts <- left.opts.default
  } else{
    not.given <- names(left.opts.default)[!names(left.opts.default) %in% 
                                            names(left.opts)]
if (length(not.given)>0){
  left.opts[not.given] <- left.opts.default[not.given]
}
  }

if (is.null(bottom.opts)) {
  bottom.opts <- bottom.opts.default
} else{
  not.given <- names(bottom.opts.default)[!names(bottom.opts.default) %in%
                                            names(bottom.opts)]
if (length(not.given)>0){
  bottom.opts[not.given] <- bottom.opts.default[not.given]
}
}

if (is.null(title.opts)) {
  title.opts <- title.opts.default
} else{
  not.given <- names(title.opts.default)[!names(title.opts.default) %in%
                                           names(title.opts)]
if (length(not.given)>0){
  title.opts[not.given] <- title.opts.default[not.given]
}
}

  showLabels <- TRUE
  viewPortWidths <- c(leftWidthProportion, 
                      1, 
                      rep(c(spacingProportion,1), 
                          numCol - 1))
  viewPortHeights <- c(rep(c(1,
                             spacingProportion), 
                           numCol - 1), 
                       1, 
                       bottomHeightProportion)

viewPortCount <- length(viewPortWidths)

if(!is.null(titleLabel)){
  pushViewport(viewport(height = unit(1,"npc") - unit(.4,"lines")))
  do.call('grid.text', c(title.opts[names(title.opts)!='gp'], 
                         list(label=titleLabel, 
                              gp=do.call('gpar', 
                                      title.opts[['gp']]))))
  popViewport()
}

  # viewport for Left Names
  pushViewport(viewport(width=unit(1, "npc") - unit(2,"lines"), 
                        height=unit(1, "npc") - unit(3, "lines")))

  ## new for axis spacingProportion
  pushViewport(viewport(layout = grid.layout(
    viewPortCount, viewPortCount,
    widths = viewPortWidths, heights = viewPortHeights
  )))

  # Left Side
  for(i in 1:numCol){
    do.call('grid.text', 
            c(left.opts[names(left.opts)!='gp'], 
              list(label=varLabels[i], 
                   vp = vplayout(as.numeric(i) * 2 - 1 ,1),
                   gp=do.call('gpar', 
                           left.opts[['gp']]))))
  }
  popViewport()# layout
  popViewport()# spacing

  # viewport for Bottom Names
  pushViewport(viewport(width=unit(1, "npc") - unit(3,"lines"), 
                        height=unit(1, "npc") - unit(2, "lines")))

  ## new for axis spacing
  pushViewport(viewport(layout = grid.layout(
    viewPortCount, viewPortCount,
    widths = viewPortWidths, heights = viewPortHeights)))

  # Bottom Side
  for(i in 1:numCol){
    do.call('grid.text', 
            c(bottom.opts[names(bottom.opts)!='gp'], 
              list(label=varLabels[i], 
                   vp = vplayout(2*numCol, 2*i),
                   gp=do.call('gpar', 
                           bottom.opts[['gp']]))))
  }

  popViewport() #layout
  popViewport() #spacing
}

这里是调用该函数的示例:

require('data.table')
require('GGally')
require('grid')
fake.data <- data.table(test.1=rnorm(50), #make some fake data for  demonstration
                        test.2=rnorm(50), 
                        test.3=rnorm(50),
                        test.4=rnorm(50))

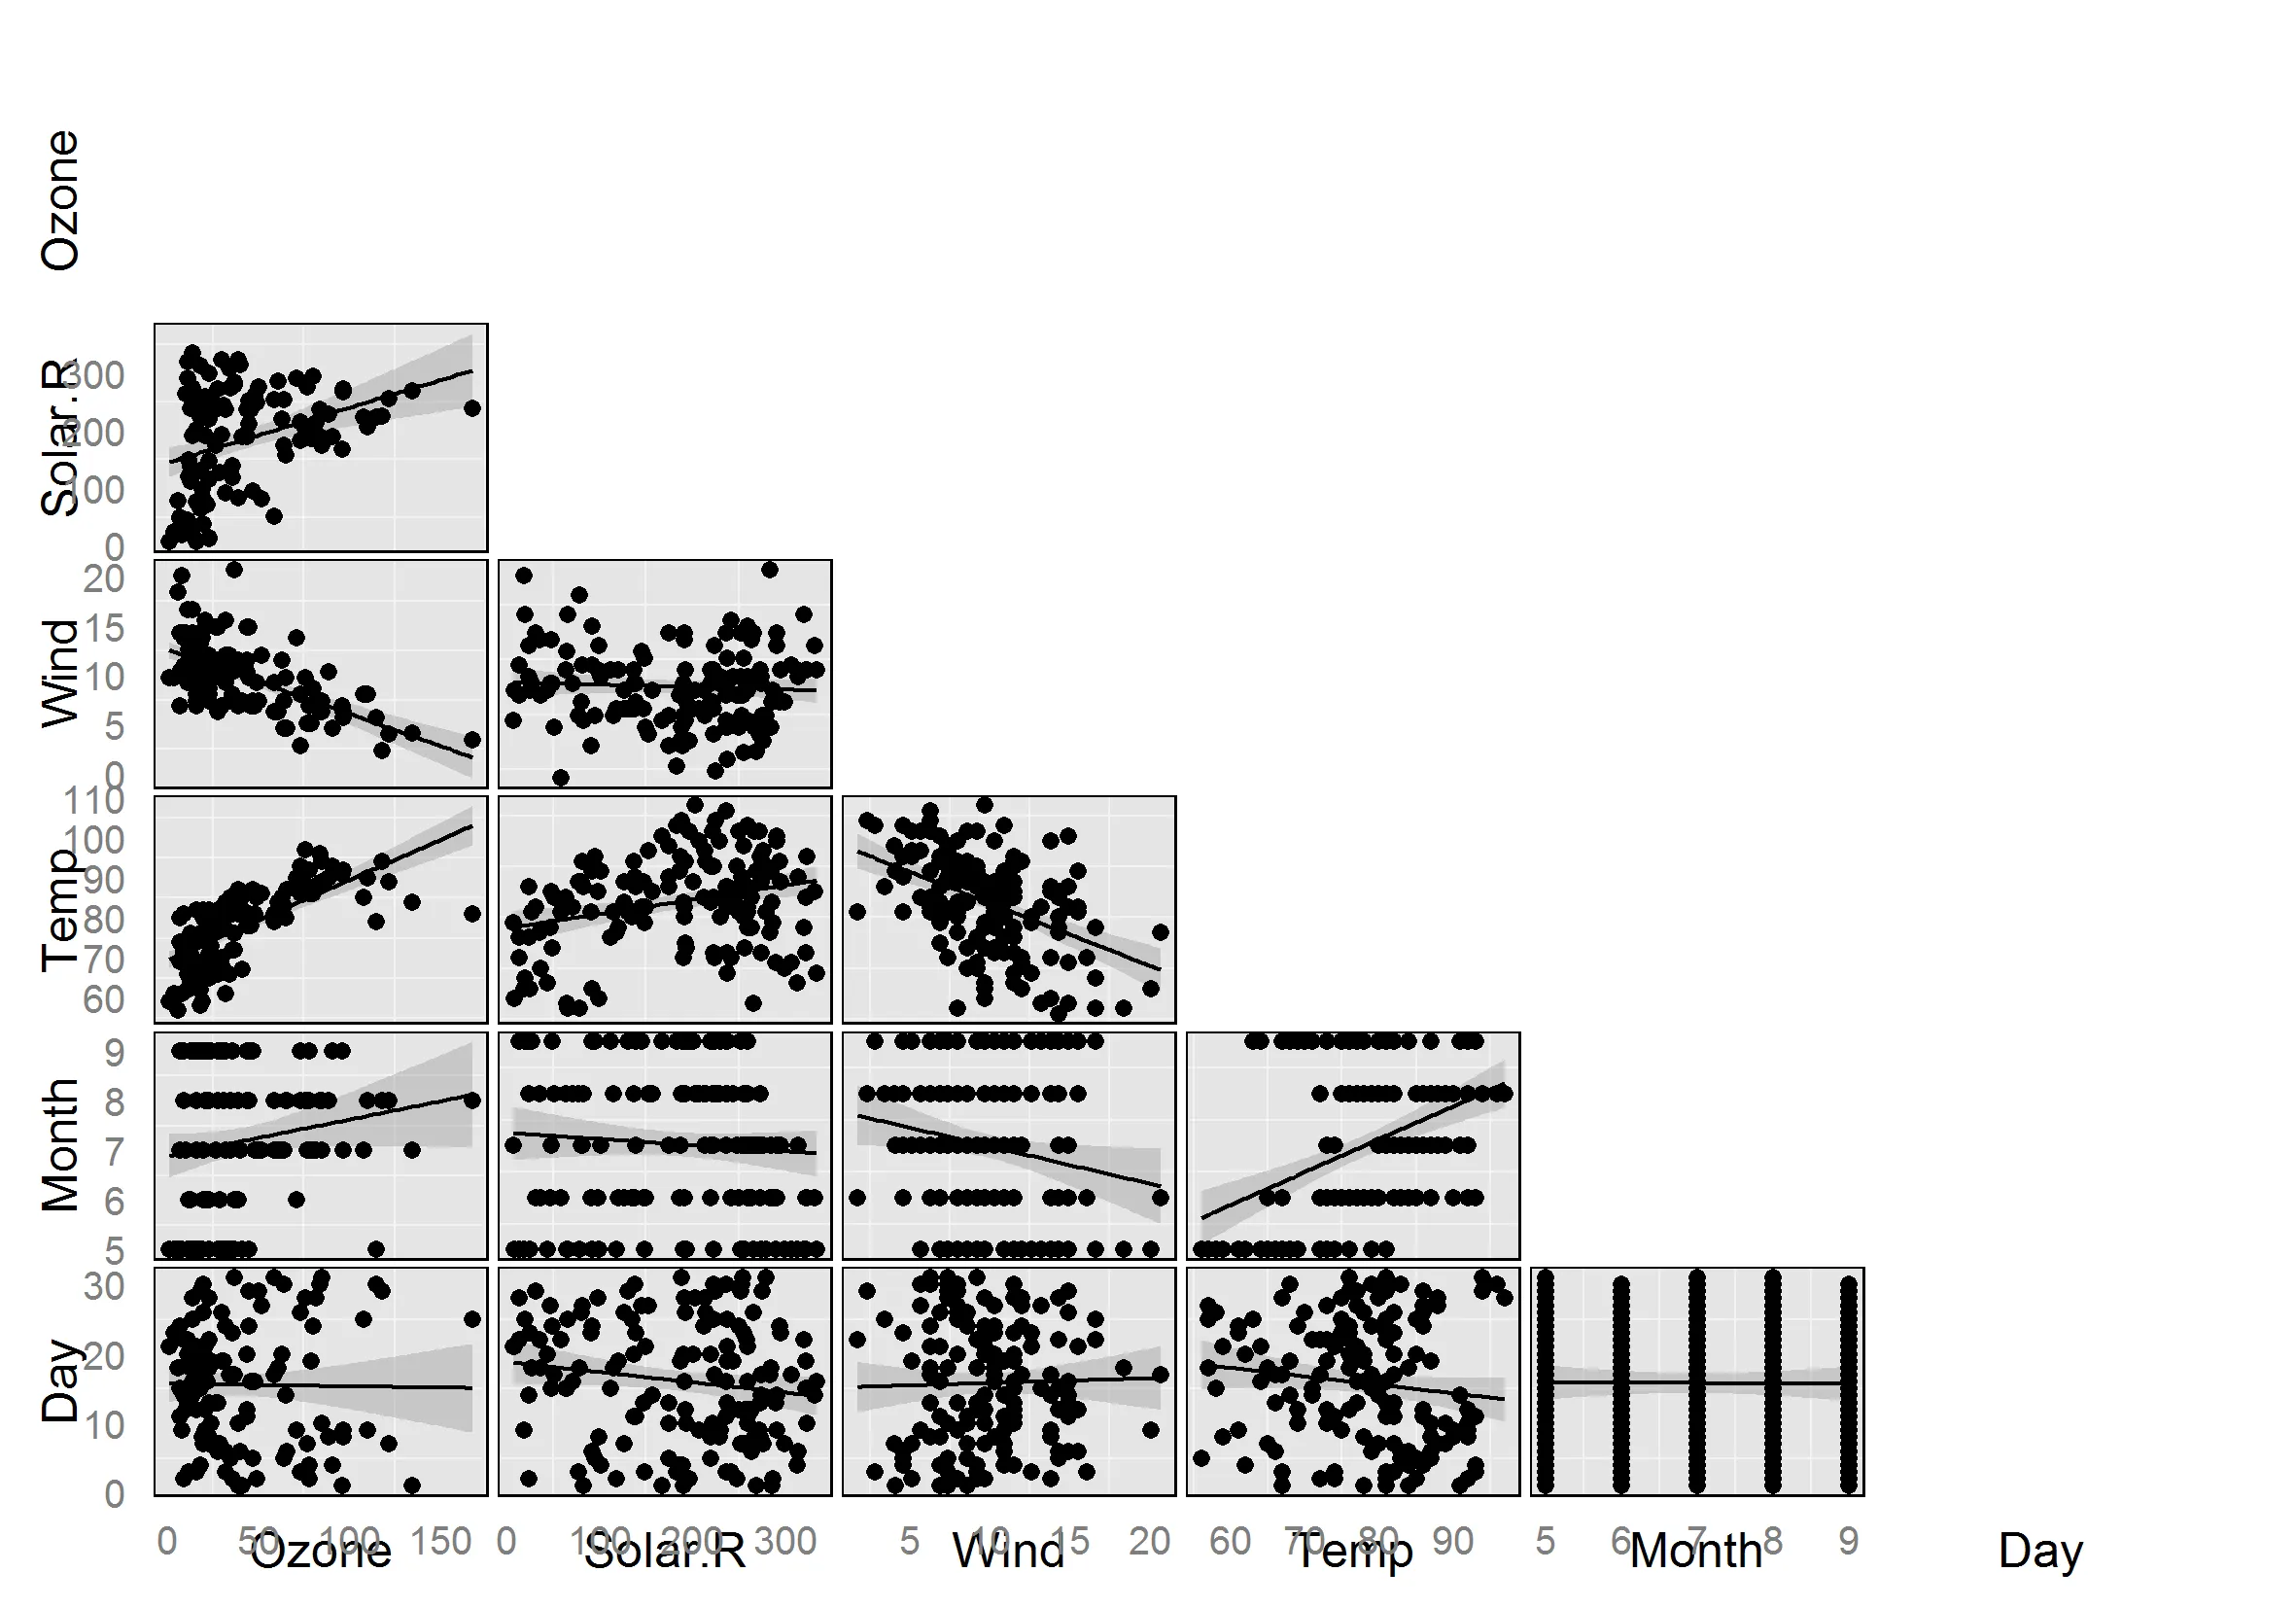
g <- ggpairs(data=fake.data, 
             columnLabels=rep('', ncol(fake.data)))
#Set columnLabels to a vector of blank column labels
#so that original variable labels will be blank.
print(g)


customize.labels(plotObj=g,
                 titleLabel = 'Test plot', #string for title
                 left.opts = list(x=-0.5, #moves farther to the left, away from vertical axis
                                  y=0.5, #centered with respect to vertical axis
                                  just=c('center', 'center'),
                                  rot=90,
                                  gp=list(col='red',
                                          fontface='italic',
                                          fontsize=12)), 
                 bottom.opts = list(x=0.5,
                                    y=0,
                                    rot=45, #angle the text at 45 degrees
                                    just=c('center', 'top'),
                                    gp=list(col='red',
                                            fontface='bold',
                                            fontsize=10)), 
                 title.opts = list(gp=list(col='green',
                                           fontface='bold.italic'))
)

(这样会产生一些非常丑陋的标签 - 仅供演示用途!)

我没有尝试调整标签位置,例如在您的地理可视化示例中左侧和底部之外的其他位置,但我认为通过更改customize.labels中“左侧”和“底部”代码片段中vplayout的参数来完成。 grid.text中的xy坐标是相对于视口定义的,该视口将显示区域划分为网格。

pushViewport(viewport(layout = grid.layout(
        viewPortCount, viewPortCount,
        widths = viewPortWidths, heights = viewPortHeights
      )))
调用 vplayout 确定了每个标签的位置使用哪个网格单元格。

我认为这应该被推入
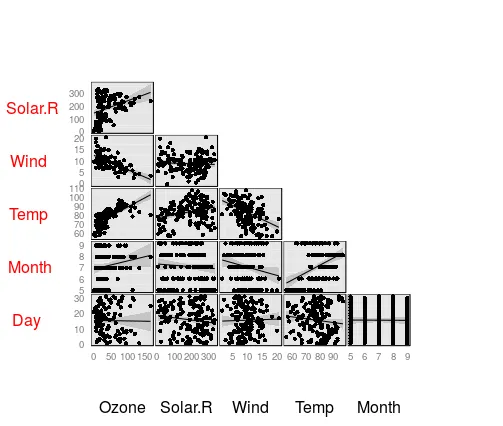
GGally,只需向ggpairs添加附加参数,其默认值可与当前版本完全兼容。 - mschilli

12

注意:这不是完整的答案,但可能会提供一种方法来解决它。您可以通过编辑grid对象来实现此目的。

# Plot in current window
# use left to add space at y axis and bottom for below xaxis
# see ?print.ggpairs
print(pairs.chrt, left = 1, bottom = 1)

# Get list of grobs in current window and extract the axis labels
# note if you add a title this will add another text grob, 
# so you will need to tweak this so not to extract it
g <- grid.ls(print=FALSE)
idx <- g$name[grep("text", g$name)]

# Rotate yaxis labels
# change the rot value to the angle you want
for(i in idx[1:6]) {
        grid.edit(gPath(i), rot=0, hjust=0.25, gp = gpar(col="red"))
 }

# Remove extra ones if you want
n <- ncol(airquality)
lapply(idx[c(1, 2*n)], grid.remove)

输入图像描述


1
就像我说的一样,这太棒了!我自己尝试了一下,它完美地工作了。只有一个小问题:我可以添加一个图例(因为我已经给我的绘图着色)吗?我找到了一种方法,但它会为每个单独的绘图绘制一个图例。编辑:没关系:https://dev59.com/lWAg5IYBdhLWcg3w_fLV :) - Marie-Louise

3

我的回答无法解决对角线标签问题,但可以解决覆盖问题。

我在撰写报告时遇到了这个问题,在ggpairs中轴标题总是在轴上方。我结合调整out.height/out.width和fig.height/fig.width解决了这个问题。单独使用这两种方法都无法解决问题,但一起使用就可以了。fig.height/fig.width将标签从轴上移开,但使它们变得太小而难以阅读,而out.height/out.width只是让绘图变大,问题仍然存在。以下是给我带来所需结果的内容:

out.height="400px", out.width="400px",fig.height=10,fig.width=10

之前:带有问题的图表

之后:


"the below" 应该放在哪里?你能发一个更完整的例子吗?这些似乎不能作为参数传递给 ggpairs... - Kuba hasn't forgotten Monica

网页内容由stack overflow 提供, 点击上面的
可以查看英文原文,
原文链接