在像下面这样的简单密度直方图和曲线中,我该如何检索给定X值的Y值。例如,在mean(dat)处的Y值是多少?
dat<-c(5,7,4,6,4,3,55,6,7,5,4,3,33,44,5,2,33,22)
hist (dat,freq=F)
lines(density(dat), col="red", lwd=2)
感谢您的选择。
谢谢。
在像下面这样的简单密度直方图和曲线中,我该如何检索给定X值的Y值。例如,在mean(dat)处的Y值是多少?
dat<-c(5,7,4,6,4,3,55,6,7,5,4,3,33,44,5,2,33,22)
hist (dat,freq=F)
lines(density(dat), col="red", lwd=2)
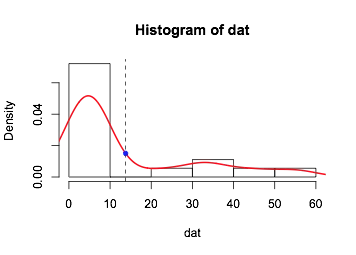
approxfun()与density的结果一起使用,以得到近似密度的函数。dat <- c(5, 7, 4, 6, 4, 3, 55, 6, 7, 5, 4, 3, 33, 44, 5, 2, 33, 22)
hist(dat, freq=F)
lines(d<-density(dat), col="red", lwd=2)
#get density function
dd <- approxfun(d$x, d$y)
dd(mean(dat))
# [1] 0.015039
#plot results
abline(v=mean(dat), lty=2)
points(mean(dat), dd(mean(dat)), cex=1.2, pch=20, col="blue")