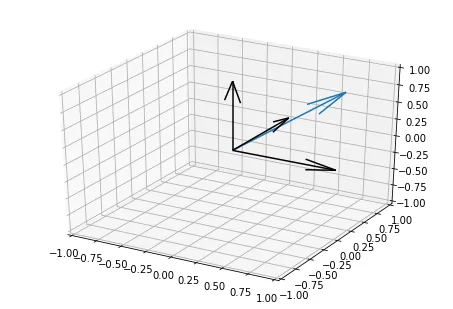
我宁愿不使用
quiver,因为它不能正确处理
float128类型的输入参数
X、
Y、
Z、
U、
V和
W。实际上,它会将这些输入静默转换为
float,而我们系统中通常是
float64。因此,
float128输入会导致溢出!
相反,我想使用
CT Zhu的简短类
Arrow3D(在
this wonderful answer中)来代替。它可以无缺陷地处理
float128坐标并提供各种
箭头样式。
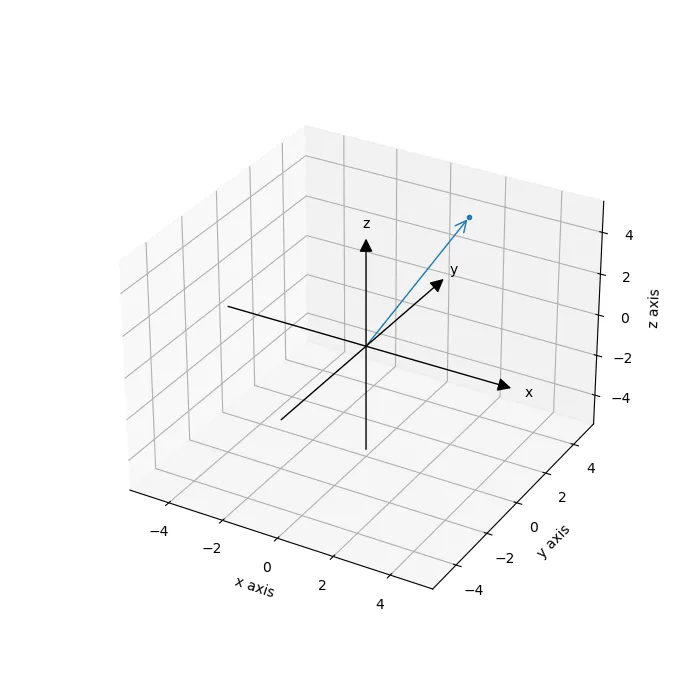
在那个帮助下,我开发了这个函数来在图形中心绘制X、Y和Z轴:
import numpy as np
import matplotlib.pyplot as plt
from Arrow3D import Arrow3D
def draw_xyz_axes_at_center(mpl_ax):
x_lim = abs(max(mpl_ax.get_xlim(), key=abs))
y_lim = abs(max(mpl_ax.get_ylim(), key=abs))
z_lim = abs(max(mpl_ax.get_zlim(), key=abs))
max_lim = max(x_lim, y_lim, z_lim)
mpl_ax.set_xlim(-max_lim, max_lim)
mpl_ax.set_ylim(-max_lim, max_lim)
mpl_ax.set_zlim(-max_lim, max_lim)
axes = ['x', 'y', 'z']
for i, axis in enumerate(axes):
start_end_pts = np.zeros((3, 2))
start_end_pts[i] = [-max_lim, max_lim]
xs, ys, zs = start_end_pts[0], start_end_pts[1], start_end_pts[2]
a = Arrow3D(xs, ys, zs,
mutation_scale=20, arrowstyle='-|>', color='black')
mpl_ax.add_artist(a)
end_pt_with_padding = start_end_pts[:, 1] * 1.1
mpl_ax.text(*end_pt_with_padding,
axis,
horizontalalignment='center',
verticalalignment='center',
color='black')
要绘制矢量图形:
def draw_vector(mpl_ax, v):
xs = [0, v[0]]
ys = [0, v[1]]
zs = [0, v[2]]
a = Arrow3D(xs, ys, zs,
mutation_scale=20, arrowstyle='->', color='#1f77b4')
mpl_ax.add_artist(a)
mpl_ax.plot(*v, '.', color='#1f77b4')
让我们使用它们:
ax = plt.figure(figsize=(7, 7)).add_subplot(projection='3d')

draw_vector(ax, np.array([2, 3, 5]))

draw_xyz_axes_at_center(ax)

ax.set_xlabel('x axis')
ax.set_ylabel('y axis')
ax.set_zlabel('z axis')

plt.show()
输出:
顺便说一下,我使用的是Python 3,并且没有在Python 2上进行测试。