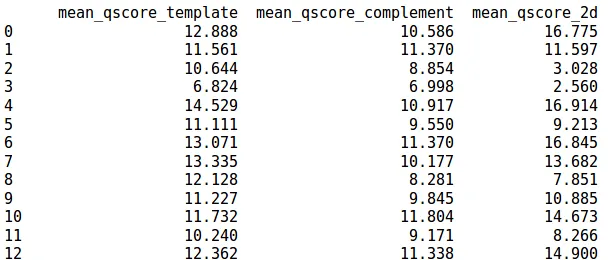
我有一个像这样的DataFrame:
我尝试了以下两个指令:
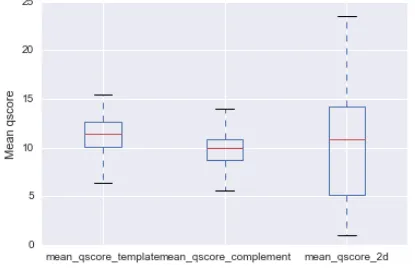
sns.boxplot([dataFrame.mean_qscore_template,dataFrame.mean_qscore_complement,dataFrame.mean_qscore_2d])

sns.boxplot(x = "mean_qscore_template", y= "mean_qscore_complement", hue = "mean_qscore_2d" data = tips)
我希望能在x轴上获得
mean_qscore_template,mean_qscore_complement和mean_qscore_2d的度量,y轴上是度量值,但是它并不起作用。
在文档中,他们提供了一个带有提示的示例,但是我的dataFrame没有以相同的方式组织。