有没有一种方法将数组范围作为参数传递给函数?
类似于:
> blah(ary,arg1=1:5)

def blah(ary,arg1): print ary[arg1]
Python只接受方括号中的1:5语法。解释器会将其转换为slice对象,然后该对象的__getitem__方法应用该切片。
请查看numpy/lib/index_tricks.py以了解一些利用此功能的函数。实际上它们不是函数,而是定义自己的__getitem__方法的类。那个文件可能会给您带来启示。
但如果您没有达到那个水平,那么可能性包括:
blah(arr, slice(1, 5))
blah(arr, np.r_[1:5])
nd_grid、mgrid和ogrid将“切片”概念扩展到接受虚拟的“步长”值:
mgrid[-1:1:5j]
# array([-1. , -0.5,  0. ,  0.5,  1. ])
请注意,在将切片传递给您的blah函数之前扩展任何内容,都不会知道其他参数的形状。因此,np.r_[:-1]只返回[]。
而且,slice中可以使用None:例如,slice(None,None,-1)等同于[::-1]。
>>> def blah(ary,arg1):
...     print ary[arg1]
>>> blah(range(10), slice(1, 5))
[1, 2, 3, 4]
你的HTML代码
def blah(ary, arg):
    arg = map(int, arg.split(":"))
    print ary[arg[0]:arg[1]]

blah([1,2,3,4,5,6],"2:5")
输出:
[3, 4, 5]
刚刚今天看到它发生,我觉得很好奇,注意到他们将参数 test_idx作为一个简单的范围传递。
plot_decision_regions(X=X_combined_std, y=y_combined,
                      classifier=ppn, test_idx=range(105, 150))
用它来切割一个Numpy数组
ndarray[range(105, 150), :]
然而,当我通过复制ndarray值、实例化并尝试自己切片(基本上是创建一个列表)进行测试时,似乎无法在切片中传递该范围。
[[0.73088538 1.57698181],[0.17316034 0.1348488]]
erick = [[0.73088538, 1.57698181],[0.17316034, 0.1348488]]
- SyntaxError。无效语法
erick = [[0.73088538,1.57698181],[0.17316034,0.1348488]]
erick [:]
(有效,返回整个内容)
erick [range(0,1),:]
- TypeError。列表索引必须是整数或切片,而不是元组
(出现错误,我们之前测试过切片工作,所以它与范围有关)

erickNpa = np.asarray(erick, dtype=np.float32)
erickNpa[range(0, 1), :]
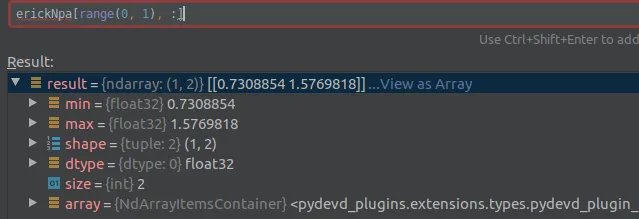
如第一部分所示,您可以将范围作为参数传递。在某些情况下,代码无法执行,但这与它正在执行的操作的性质有关(使用它来切片列表),但是通过正确的支架,当使用Numpy数组时似乎一切正常。
我还会放置函数定义,以防Git被关闭,即使我已经链接了该行。
def plot_decision_regions(X, y, classifier, test_idx=None, resolution=0.02):

    # setup marker generator and color map
    markers = ('s', 'x', 'o', '^', 'v')
    colors = ('red', 'blue', 'lightgreen', 'gray', 'cyan')
    cmap = ListedColormap(colors[:len(np.unique(y))])

    # plot the decision surface
    x1_min, x1_max = X[:, 0].min() - 1, X[:, 0].max() + 1
    x2_min, x2_max = X[:, 1].min() - 1, X[:, 1].max() + 1
    xx1, xx2 = np.meshgrid(np.arange(x1_min, x1_max, resolution),
                           np.arange(x2_min, x2_max, resolution))
    Z = classifier.predict(np.array([xx1.ravel(), xx2.ravel()]).T)
    Z = Z.reshape(xx1.shape)
    plt.contourf(xx1, xx2, Z, alpha=0.3, cmap=cmap)
    plt.xlim(xx1.min(), xx1.max())
    plt.ylim(xx2.min(), xx2.max())

    for idx, cl in enumerate(np.unique(y)):
        plt.scatter(x=X[y == cl, 0],
                    y=X[y == cl, 1],
                    alpha=0.8,
                    c=colors[idx],
                    marker=markers[idx],
                    label=cl,
                    edgecolor='black')

    # highlight test examples
    if test_idx:
        # plot all examples
        X_test, y_test = X[test_idx, :], y[test_idx]

        plt.scatter(X_test[:, 0],
                    X_test[:, 1],
                    c='',
                    edgecolor='black',
                    alpha=1.0,
                    linewidth=1,
                    marker='o',
                    s=100,
                    label='test set')


# Training a perceptron model using the standardized training data:


X_combined_std = np.vstack((X_train_std, X_test_std))
y_combined = np.hstack((y_train, y_test))

plot_decision_regions(X=X_combined_std, y=y_combined,
                      classifier=ppn, test_idx=range(105, 150))
plt.xlabel('petal length [standardized]')
plt.ylabel('petal width [standardized]')
plt.legend(loc='upper left')

plt.tight_layout()
#plt.savefig('images/03_01.png', dpi=300)
plt.show()
slice(1, 5)。 - Ashwini Chaudhary