我有一个涉及3D的函数,我们称之为De Jong函数:
fdejong <- function (x, y) {
   return (x^2 + y^2)
}
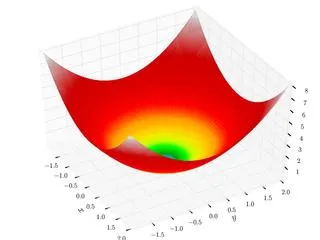
我该如何在3D中绘制它的图像?我想要实现与维基百科类似的效果:
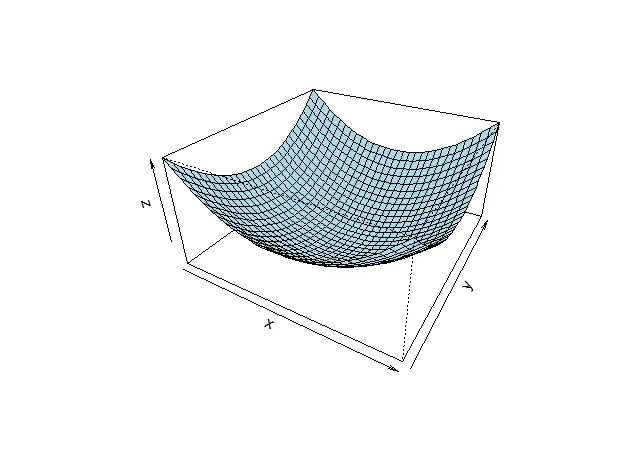
尝试这个:
fdejong <- function (x, y) {
   return (x^2 + y^2)
}


x <- seq(-10, 10, length= 30)
y <- x
z <- outer(x, y, fdejong)
z[is.na(z)] <- 1
op <- par(bg = "white")
persp(x, y, z, theta = 30, phi = 30, expand = 0.5, col = "lightblue")
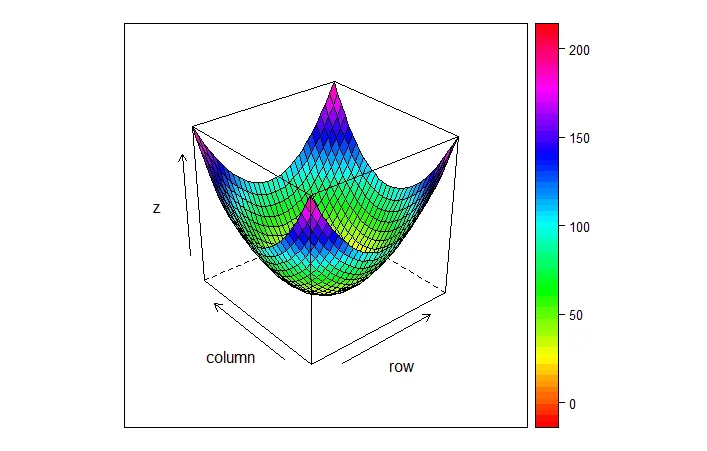
您还可以使用Lattice的wireframe功能。(使用@user1020027的数据)
fdejong <- function (x, y) {
   return (x^2 + y^2)
}

x <- seq(-10, 10, length= 30)
y <- x
z <- outer(x, y, fdejong)
z[is.na(z)] <- 1

require(lattice)
wireframe(z, drape=T, col.regions=rainbow(100))
emdbook包中的curve3d()函数。 - Ben Bolker