在使用Cartopy地图时,我无法添加xlabel或ylabel。有没有办法做到这一点?我不是寻找刻度标签。
import matplotlib.pyplot as plt
import cartopy
ax = plt.axes(projection=cartopy.crs.PlateCarree())
ax.add_feature(cartopy.feature.COASTLINE)
ax.set_xlabel('lon')
ax.set_ylabel('lat')
plt.show()
在使用Cartopy地图时,我无法添加xlabel或ylabel。有没有办法做到这一点?我不是寻找刻度标签。
import matplotlib.pyplot as plt
import cartopy
ax = plt.axes(projection=cartopy.crs.PlateCarree())
ax.add_feature(cartopy.feature.COASTLINE)
ax.set_xlabel('lon')
ax.set_ylabel('lat')
plt.show()
Cartopy的matplotlib网格线控制器接管了xlabel和ylabel,用于管理网格线和标签。 https://github.com/SciTools/cartopy/blob/master/lib/cartopy/mpl/gridliner.py#L93
import matplotlib.pyplot as plt
import cartopy
ax = plt.axes(projection=cartopy.crs.PlateCarree())
ax.add_feature(cartopy.feature.COASTLINE)
gridlines = ax.gridlines(draw_labels=True)
# this would not function, due to the gridliner
# ax.set_xlabel('lon')
# ax.set_ylabel('lat')
plt.show()
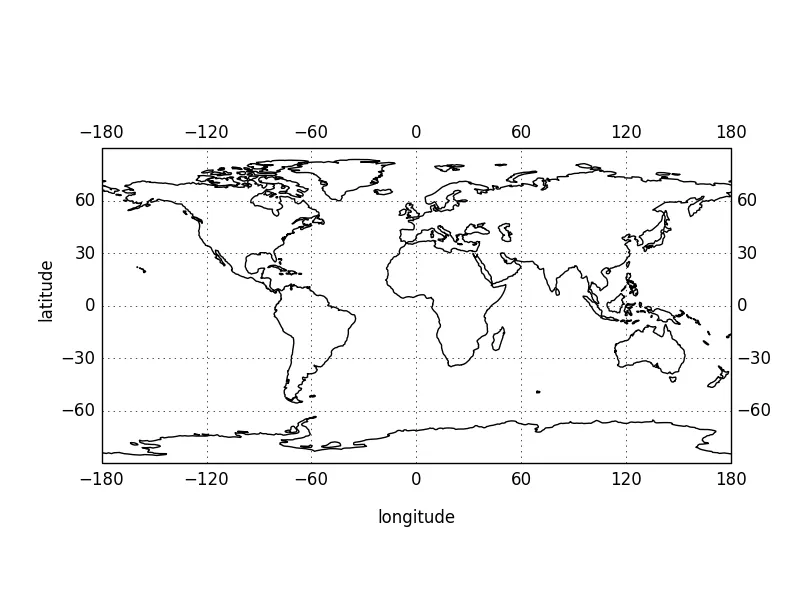
如果您希望为cartopy轴的轴标签添加标签,您应该将它们放置在不与网格线重叠的位置。目前,您需要手动执行此操作,例如:
import matplotlib.pyplot as plt
import cartopy
ax = plt.axes(projection=cartopy.crs.PlateCarree())
ax.add_feature(cartopy.feature.COASTLINE)
gridlines = ax.gridlines(draw_labels=True)
ax.text(-0.07, 0.55, 'latitude', va='bottom', ha='center',
        rotation='vertical', rotation_mode='anchor',
        transform=ax.transAxes)
ax.text(0.5, -0.2, 'longitude', va='bottom', ha='center',
        rotation='horizontal', rotation_mode='anchor',
        transform=ax.transAxes)
plt.show()
偶然发现运行...
import matplotlib.pyplot as plt
import cartopy
ax = plt.axes(projection=cartopy.crs.PlateCarree())
ax.add_feature(cartopy.feature.COASTLINE)
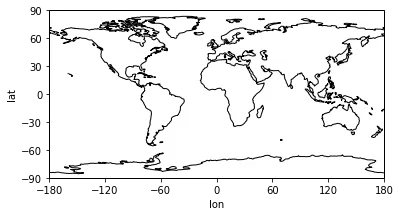
ax.set_xlabel('lon')
ax.set_ylabel('lat')
ax.set_xticks([-180,-120,-60,0,60,120,180])
ax.set_yticks([-90,-60,-30,0,30,60,90])
plt.show()
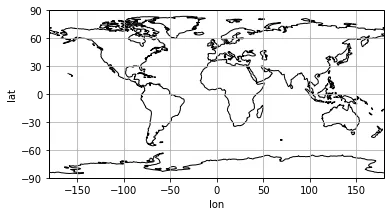
...它打印出x轴刻度和y轴刻度,还有x轴标签和y轴标签。在其他情况下,如果x轴刻度和y轴刻度已经被定义,在执行此操作后,它们将被恢复...
ax.set_xticks(ax.get_xticks())
ax.set_yticks(ax.get_yticks())
或者在它们自动地生成超出地图范围的情况下
ax.set_xticks(ax.get_xticks()[abs(ax.get_xticks())<=180])
ax.set_yticks(ax.get_yticks()[abs(ax.get_yticks())<=90])
添加网格的方法如下:
plt.grid()
ax.set_yticks([])。经过 Python 3.7.6,Cartopy 0.17.0,Matplotlib 3.1.3 的测试。 - lanadaquenada