我想简单地创建一个条形图,包含一些数据(此处硬编码,但最终我会从文件中读取数据)。目前为止,我已经能够得到条形图,但是我希望属性“特征名称”出现在每个条形下面。现在,我只得到了1到16的数字。我该怎么做才能使每个特征都出现在相应的条形下面呢?
我的代码:
import matplotlib.pyplot as plt
import numpy as np
import mpld3
fig, ax = plt.subplots()
N = 17
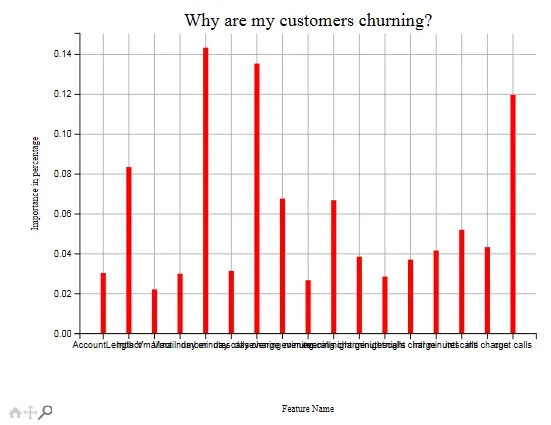
feature_name = ('AccountLength','Intlact','Vmailact','Vmailnumber','day minutes','day calls','day charge','evening minutes','evening calls','evening charge','night minutes','night calls','night charge','intl minutes','intl calls','intl charge','cust calls')
importance = (0.0304,0.0835,0.0222,0.0301,0.1434,0.0315,0.1354,0.0677,0.0268,0.0669,0.0386,0.0286,0.0371,0.0417,0.0521,0.0434,0.1197)
ind = np.arange(N)
width = 0.20
rects = ax.bar(ind, importance, width, color = 'r')
ax.grid(color='white', linestyle='solid')
ax.set_title("Why are my customers churning?", size=20)
ax.set_ylabel('Importance in percentage')
ax.set_xlabel('Feature Name')
ax.set_xticklabels( (feature_name) )
labels = (feature_name)
tooltip = mpld3.plugins.PointLabelTooltip(rects, labels=labels)
mpld3.plugins.connect(fig, tooltip)
mpld3.show()
编辑:事实证明,如果我使用plt.show(),我可以看到刻度标签,但当我尝试在mpld3中执行相同操作时,它不起作用。同时想知道为什么工具提示没有显示。
mpld3?你可以尝试使用来自 github 上最新的版本吗? - Abraham D Flaxman