networkx边权重不能正确映射到箭头宽度吗?

3
我尝试使用以下代码绘制图表:
import networkx as nx
import matplotlib.pyplot as plt


u = ['SAC', 'SAC', 'SAC', 'SAC', 'SAC', 'SAC', 'SAC', 'REDES SOCIAIS', 'REDES SOCIAIS', 
     'REDES SOCIAIS', 'PROCON', 'PROCON', 'PROCON', 'BACEN', 'BACEN', 'BACEN', 'BACEN',
     'OUVIDORIA', 'OUVIDORIA', 'OUVIDORIA', 'OUVIDORIA', 'OUVIDORIA', 'CHAT', 'CHAT', 
     'CHAT']
v = ['RECLAME AQUI', 'SAC', 'REDES SOCIAIS', 'PROCON', 'BACEN', 'OUVIDORIA', 'CHAT', 
     'RECLAME AQUI', 'SAC', 'REDES SOCIAIS', 'RECLAME AQUI', 'SAC', 'PROCON',
     'RECLAME AQUI', 'SAC', 'BACEN', 'OUVIDORIA', 'RECLAME AQUI', 'SAC', 
     'REDES SOCIAIS', 'BACEN', 'OUVIDORIA', 'RECLAME AQUI', 'SAC', 'REDES SOCIAIS']
w = [437, 207, 13, 1, 7, 13, 2, 70, 10, 12, 5, 
     1, 2, 23, 1, 4, 2, 16, 2, 2, 2, 4, 4, 1, 1]

G = nx.DiGraph()
for ui, vi, wi in zip(u, v, w):
    G.add_edges_from([(ui, vi)], weight=wi)
pos = nx.circular_layout(G)
edge_labels = dict([((u, v,), d['weight']) for u, v, d in G.edges(data=True)])
weights = [G[u][v]['weight'] for u, v in G.edges()]
weights = list(map(lambda x: (x - min(weights)) /
                   (max(weights) - min(weights)), weights))
weights = list(map(lambda x: (x * 4) + 1, weights))
i = 0
for u, v in G.edges():
    print(u, v, G[u][v]['weight'], weights[i])
    i += 1

fig = plt.figure(figsize=(25, 15))
plt.axis('off')
nx.draw_networkx_edge_labels(G, pos, edge_labels=edge_labels)
nx.draw_networkx_nodes(G, pos,
                       nodelist=G.nodes(),
                       node_color='r',
                       node_size=500)
nx.draw_networkx_edges(G, pos,
                       edgelist=G.edges(),
                       alpha=0.5, edge_color='#5cce40', width=weights)
nx.draw_networkx_labels(G, pos, font_size=16, font_color='white')

fig.set_facecolor("#262626")
plt.show()

它从Pandas数据帧创建了一个边缘的词典,但重要部分是在我声明 G = nx.DiGraph() 时开始的。此时,我拥有所有加权边缘,并将它们归一化到 [1,5] 之间。 print语句会给我输出这些信息:
SAC RECLAME AQUI 437 5.0
SAC SAC 207 2.8899082568807337
SAC REDES SOCIAIS 13 1.110091743119266
SAC PROCON 1 1.0
SAC BACEN 7 1.0550458715596331
SAC OUVIDORIA 13 1.110091743119266
SAC CHAT 2 1.0091743119266054
REDES SOCIAIS RECLAME AQUI 70 1.6330275229357798
REDES SOCIAIS SAC 10 1.0825688073394495
REDES SOCIAIS REDES SOCIAIS 12 1.1009174311926606
PROCON RECLAME AQUI 5 1.036697247706422
PROCON SAC 1 1.0
PROCON PROCON 2 1.0091743119266054
BACEN RECLAME AQUI 23 1.2018348623853212
BACEN SAC 1 1.0
BACEN BACEN 4 1.0275229357798166
BACEN OUVIDORIA 2 1.0091743119266054
OUVIDORIA RECLAME AQUI 16 1.1376146788990826
OUVIDORIA SAC 2 1.0091743119266054
OUVIDORIA REDES SOCIAIS 2 1.0091743119266054
OUVIDORIA BACEN 2 1.0091743119266054
OUVIDORIA OUVIDORIA 4 1.0275229357798166
CHAT RECLAME AQUI 4 1.0275229357798166
CHAT SAC 1 1.0
CHAT REDES SOCIAIS 1 1.0
  • 在SAC -> RECLAME AQUI之间,可能的最高权重为5.0
  • 以下是边权重最高的边(不包括自环,我不知道如何绘制),即REDES SOCIAIS -> RECLAME AQUI,权重为1.6330275229357798。
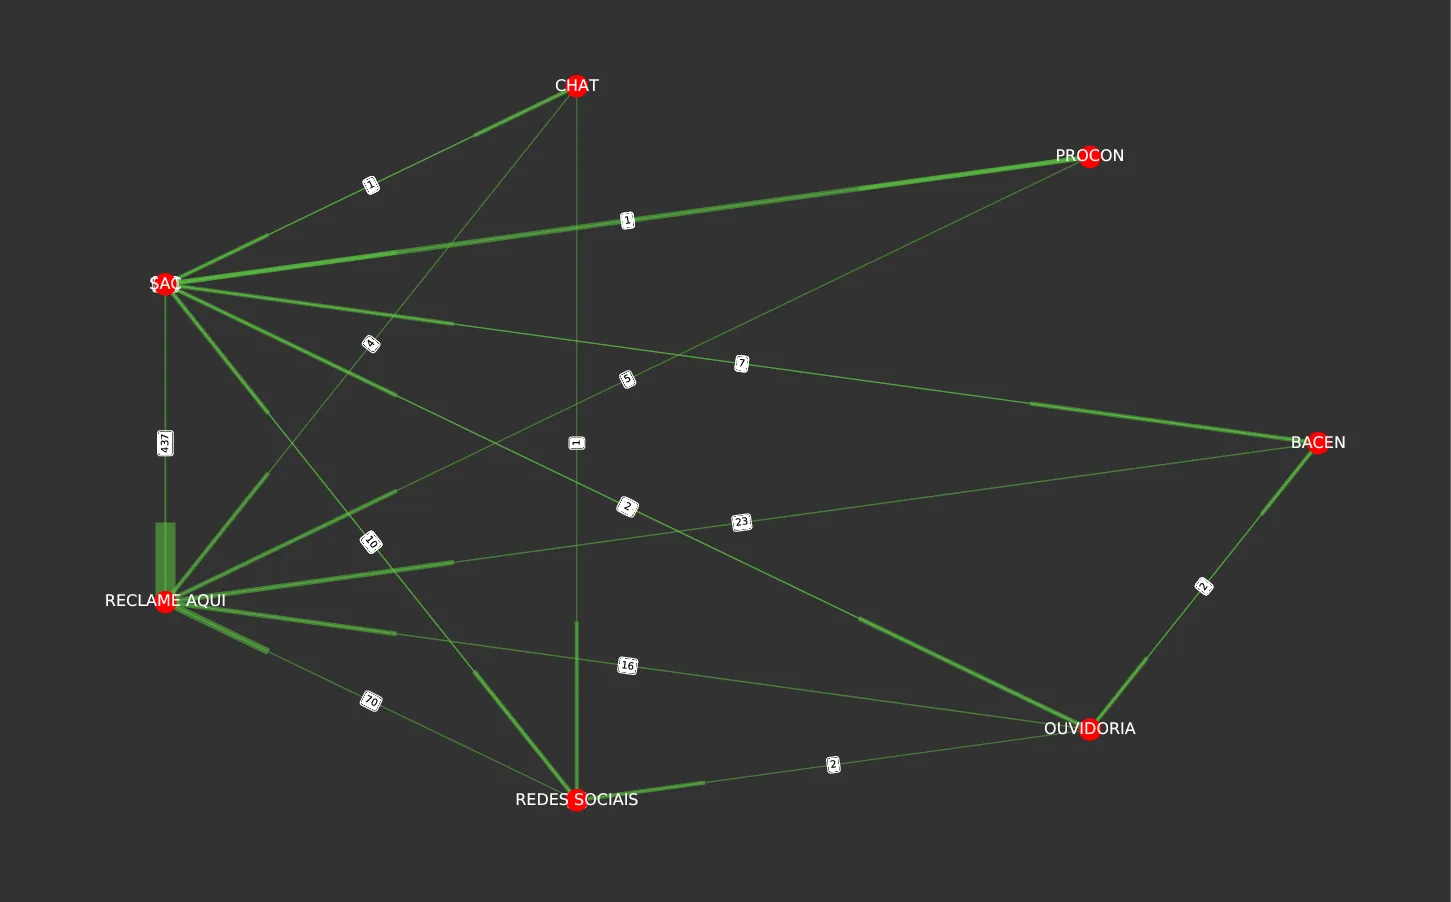
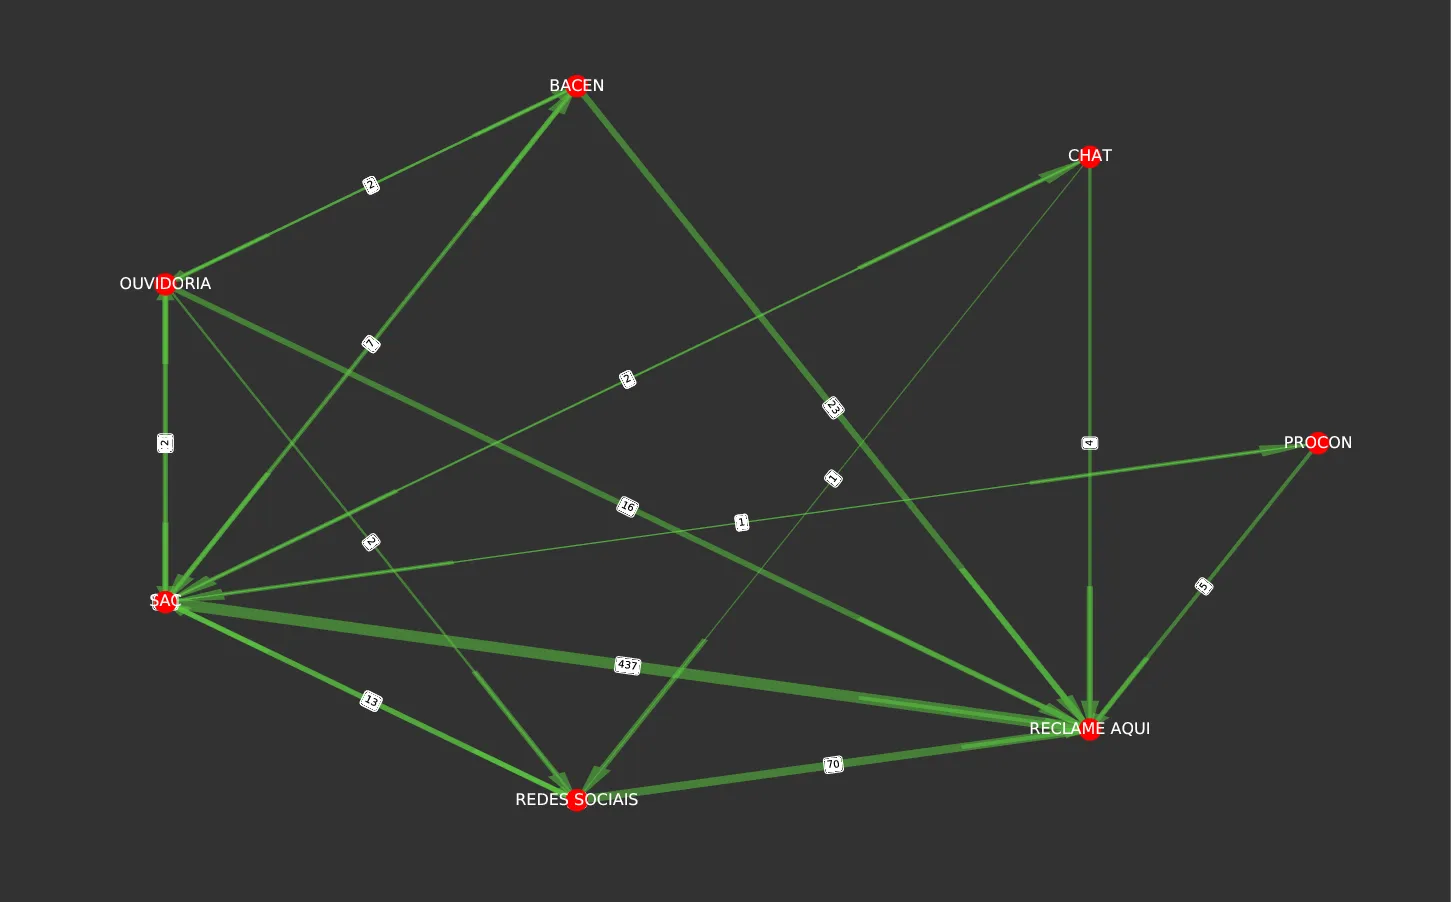
然而,这是我的图:enter image description here

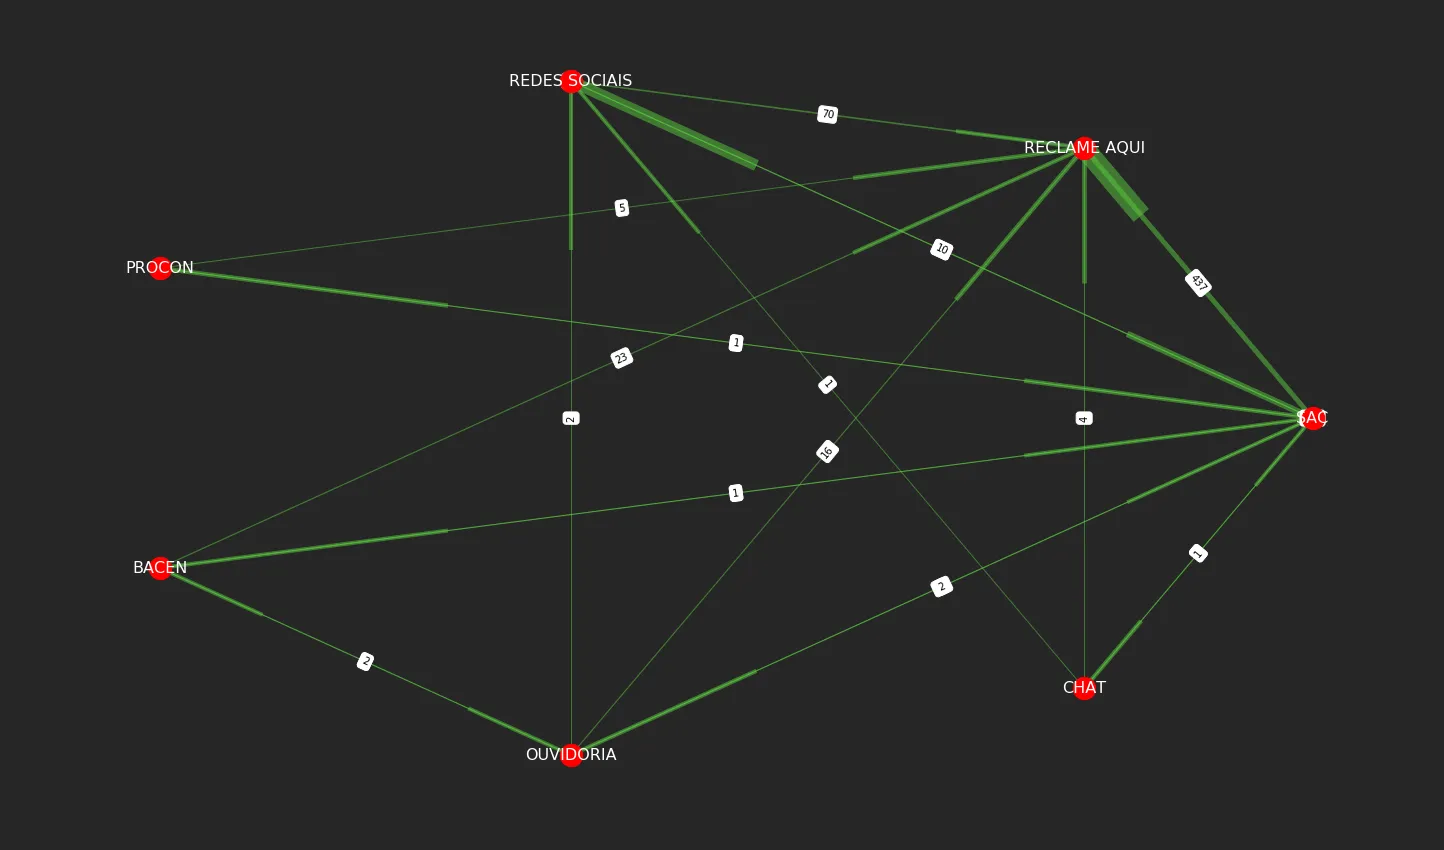
可以看出,第二宽的边是 SAC -> REDES SOCIAIS,而原始权重为70的 REDES SOCIAIS -> RECLAME AQUI 却比第一条边更细。我不明白为什么。打印显示我的映射是正确的。我是否向某个函数传递了错误的参数?


1
我修改了你的代码,使得其他人更容易重现这个问题。 - unutbu
1个回答

1

nx.draw_networkx_edges不会为自环绘制箭头。 因此,当DiGraph包含自环时,传递给nx.draw_networkx_edges的权重必须跳过自环权重。否则,权重将与绘制的边不同步。

因此,如果您更改

weights = [G[u][v]['weight'] for u, v in G.edges()]

to

weights = [G[u][v]['weight'] for u, v in G.edges() if u != v]

然后。
import networkx as nx
import matplotlib.pyplot as plt


u = ['SAC', 'SAC', 'SAC', 'SAC', 'SAC', 'SAC', 'SAC', 'REDES SOCIAIS', 'REDES SOCIAIS', 
     'REDES SOCIAIS', 'PROCON', 'PROCON', 'PROCON', 'BACEN', 'BACEN', 'BACEN', 'BACEN',
     'OUVIDORIA', 'OUVIDORIA', 'OUVIDORIA', 'OUVIDORIA', 'OUVIDORIA', 'CHAT', 'CHAT', 
     'CHAT']
v = ['RECLAME AQUI', 'SAC', 'REDES SOCIAIS', 'PROCON', 'BACEN', 'OUVIDORIA', 'CHAT', 
     'RECLAME AQUI', 'SAC', 'REDES SOCIAIS', 'RECLAME AQUI', 'SAC', 'PROCON',
     'RECLAME AQUI', 'SAC', 'BACEN', 'OUVIDORIA', 'RECLAME AQUI', 'SAC', 
     'REDES SOCIAIS', 'BACEN', 'OUVIDORIA', 'RECLAME AQUI', 'SAC', 'REDES SOCIAIS']
w = [437, 207, 13, 1, 7, 13, 2, 70, 10, 12, 5, 
     1, 2, 23, 1, 4, 2, 16, 2, 2, 2, 4, 4, 1, 1]

G = nx.DiGraph()
for ui, vi, wi in zip(u, v, w):
    G.add_edges_from([(ui, vi)], weight=wi)
pos = nx.circular_layout(G)
edge_labels = dict([((u, v,), d['weight']) for u, v, d in G.edges(data=True)])
weights = [G[u][v]['weight'] for u, v in G.edges() if u != v]
weights = list(map(lambda x: (x - min(weights)) /
                   (max(weights) - min(weights)), weights))
weights = list(map(lambda x: (x * 4) + 1, weights))
i = 0
for u, v in G.edges():
    if u != v:
        print(u, v, G[u][v]['weight'], weights[i])
        i += 1

fig = plt.figure(figsize=(25, 15))
plt.axis('off')
nx.draw_networkx_edge_labels(G, pos, edge_labels=edge_labels)
nx.draw_networkx_nodes(G, pos,
                       nodelist=G.nodes(),
                       node_color='r',
                       node_size=500)
nx.draw_networkx_edges(G, pos,
                       edgelist=G.edges(),
                       alpha=0.5, edge_color='#5cce40', width=weights)
nx.draw_networkx_labels(G, pos, font_size=16, font_color='white')

fig.set_facecolor("#262626")
plt.show()

产生

enter image description here


有向图中箭头的形状和厚度当前由this code设置。要将矩形“箭头”替换为尖箭头,需要使用自定义的draw_networkx_edges_with_arrows函数替换nx.draw_networkx_edges

import numpy as np
import networkx as nx
import matplotlib.pyplot as plt

def draw_networkx_edges_with_arrows(G, pos,
                        edgelist=None,
                        width=1.0,
                        edge_color='k',
                        style='solid',
                        alpha=1.0,
                        edge_cmap=None,
                        edge_vmin=None,
                        edge_vmax=None,
                        ax=None,
                        arrows=True,
                        label=None,
                        arrow_width=1.0,
                        **kwds):
    """
    Most of this code comes from https://github.com/networkx/networkx/blob/master/networkx/drawing/nx_pylab.py#L575, except that the arrow LineCollection 
    has been replaced by mpatches.Arrows below.
    """
    try:
        import matplotlib
        import matplotlib.pyplot as plt
        import matplotlib.cbook as cb
        from matplotlib.colors import colorConverter, Colormap
        from matplotlib.collections import LineCollection
        import matplotlib.patches as mpatches
        import numpy
        import itertools as IT
    except ImportError:
        raise ImportError("Matplotlib required for draw()")
    except RuntimeError:
        print("Matplotlib unable to open display")
        raise

    if ax is None:
        ax = plt.gca()

    if edgelist is None:
        edgelist = G.edges()

    if not edgelist or len(edgelist) == 0:  # no edges!
        return None

    # set edge positions
    edge_pos = numpy.asarray([(pos[e[0]], pos[e[1]]) for e in edgelist])

    if not cb.iterable(width):
        lw = (width,)
    else:
        lw = width

    if not cb.is_string_like(edge_color) \
           and cb.iterable(edge_color) \
           and len(edge_color) == len(edge_pos):
        if numpy.alltrue([cb.is_string_like(c)
                         for c in edge_color]):
            # (should check ALL elements)
            # list of color letters such as ['k','r','k',...]
            edge_colors = tuple([colorConverter.to_rgba(c, alpha)
                                 for c in edge_color])
        elif numpy.alltrue([not cb.is_string_like(c)
                           for c in edge_color]):
            # If color specs are given as (rgb) or (rgba) tuples, we're OK
            if numpy.alltrue([cb.iterable(c) and len(c) in (3, 4)
                             for c in edge_color]):
                edge_colors = tuple(edge_color)
            else:
                # numbers (which are going to be mapped with a colormap)
                edge_colors = None
        else:
            raise ValueError('edge_color must consist of either color names or numbers')
    else:
        if cb.is_string_like(edge_color) or len(edge_color) == 1:
            edge_colors = (colorConverter.to_rgba(edge_color, alpha), )
        else:
            raise ValueError('edge_color must be a single color or list of exactly m colors where m is the number or edges')

    edge_collection = LineCollection(edge_pos,
                                     colors=edge_colors,
                                     linewidths=lw,
                                     antialiaseds=(1,),
                                     linestyle=style,
                                     transOffset = ax.transData,
                                     )

    edge_collection.set_zorder(1)  # edges go behind nodes
    edge_collection.set_label(label)
    ax.add_collection(edge_collection)

    # Note: there was a bug in mpl regarding the handling of alpha values for
    # each line in a LineCollection.  It was fixed in matplotlib in r7184 and
    # r7189 (June 6 2009).  We should then not set the alpha value globally,
    # since the user can instead provide per-edge alphas now.  Only set it
    # globally if provided as a scalar.
    if cb.is_numlike(alpha):
        edge_collection.set_alpha(alpha)

    if edge_colors is None:
        if edge_cmap is not None:
            assert(isinstance(edge_cmap, Colormap))
        edge_collection.set_array(numpy.asarray(edge_color))
        edge_collection.set_cmap(edge_cmap)
        if edge_vmin is not None or edge_vmax is not None:
            edge_collection.set_clim(edge_vmin, edge_vmax)
        else:
            edge_collection.autoscale()

    arrow_collection = None

    if G.is_directed() and arrows:

        # a directed graph hack
        # draw thick line segments at head end of edge
        # waiting for someone else to implement arrows that will work
        arrow_colors = edge_colors
        # a_pos = []
        p = 1.0-0.25  # make head segment 25 percent of edge length
        for (src, dst), lwi, color in zip(edge_pos, lw, IT.cycle(arrow_colors)):
            x1, y1 = src
            x2, y2 = dst
            dx = x2-x1   # x offset
            dy = y2-y1   # y offset
            d = numpy.sqrt(float(dx**2 + dy**2))  # length of edge
            if d == 0:   # source and target at same position
                continue
            if dx == 0:  # vertical edge
                xa = x2
                ya = dy*p+y1
            if dy == 0:  # horizontal edge
                ya = y2
                xa = dx*p+x1
            else:
                theta = numpy.arctan2(dy, dx)
                xa = p*d*numpy.cos(theta)+x1
                ya = p*d*numpy.sin(theta)+y1
            dx, dy = x2-xa, y2-ya
            patch = mpatches.Arrow(xa, ya, dx, dy, 
                                   width=arrow_width, 
                                   color=color,
                                   transform=ax.transData)
            ax.add_patch(patch)

    # update view
    minx = numpy.amin(numpy.ravel(edge_pos[:, :, 0]))
    maxx = numpy.amax(numpy.ravel(edge_pos[:, :, 0]))
    miny = numpy.amin(numpy.ravel(edge_pos[:, :, 1]))
    maxy = numpy.amax(numpy.ravel(edge_pos[:, :, 1]))

    w = maxx-minx
    h = maxy-miny
    padx,  pady = 0.05*w, 0.05*h
    corners = (minx-padx, miny-pady), (maxx+padx, maxy+pady)
    ax.update_datalim(corners)
    ax.autoscale_view()

    return edge_collection


u = ['SAC', 'SAC', 'SAC', 'SAC', 'SAC', 'SAC', 'SAC', 'REDES SOCIAIS', 'REDES SOCIAIS', 
     'REDES SOCIAIS', 'PROCON', 'PROCON', 'PROCON', 'BACEN', 'BACEN', 'BACEN', 'BACEN',
     'OUVIDORIA', 'OUVIDORIA', 'OUVIDORIA', 'OUVIDORIA', 'OUVIDORIA', 'CHAT', 'CHAT', 
     'CHAT']
v = ['RECLAME AQUI', 'SAC', 'REDES SOCIAIS', 'PROCON', 'BACEN', 'OUVIDORIA', 'CHAT', 
     'RECLAME AQUI', 'SAC', 'REDES SOCIAIS', 'RECLAME AQUI', 'SAC', 'PROCON',
     'RECLAME AQUI', 'SAC', 'BACEN', 'OUVIDORIA', 'RECLAME AQUI', 'SAC', 
     'REDES SOCIAIS', 'BACEN', 'OUVIDORIA', 'RECLAME AQUI', 'SAC', 'REDES SOCIAIS']
w = [437, 207, 13, 1, 7, 13, 2, 70, 10, 12, 5, 
     1, 2, 23, 1, 4, 2, 16, 2, 2, 2, 4, 4, 1, 1]

G = nx.DiGraph()
for ui, vi, wi in zip(u, v, w):
    G.add_edges_from([(ui, vi)], weight=wi)
pos = nx.circular_layout(G)
edge_labels = dict([((u, v,), d['weight']) for u, v, d in G.edges(data=True)])
weights = [G[u][v]['weight'] for u, v in G.edges()]
weights = np.log(weights)
weights = list(map(lambda x: (x - min(weights)) /
                   (max(weights) - min(weights)), weights))
weights = list(map(lambda x: (x * 10) + 1, weights))

fig = plt.figure(figsize=(25, 15))
plt.axis('off')
nx.draw_networkx_edge_labels(G, pos, edge_labels=edge_labels)
nx.draw_networkx_nodes(G, pos,
                       nodelist=G.nodes(),
                       node_color='r',
                       node_size=500)
draw_networkx_edges_with_arrows(G, pos,
                       width=weights, arrow_width=0.05,
                       alpha=0.5, edge_color='#5cce40')
nx.draw_networkx_labels(G, pos, font_size=16, font_color='white')

fig.set_facecolor("#262626")
plt.savefig('/tmp/out.pdf', format='pdf', facecolor=fig.get_facecolor(), 
            bbox_inches='tight')

产生

enter image description here


不明白它怎么消失了。SAC -> RECLAME AQUI并不像它应该的那样厚实。 - pceccon
权重影响线宽,而不是箭头的厚度。SAC --> RECLAME AQUI具有最高的权重437,在上面的图像中是最粗的线条。 - unutbu
你有没有想过这些箭头的粗细是如何设置的?对我来说,从SAC -> PROCON的箭头比从SAC到PROCON的箭头要粗很多,这没有意义。 - pceccon
我已添加了一些代码,展示如何将矩形箭头替换为尖箭头。该代码使用固定的“箭头宽度”,不依赖于边权重。虽然可以这样做,但我不确定它是否会改善结果的外观。 - unutbu
谢谢。然而,由于 github 代码使用箭头粗细作为 'linewidths = [4 * ww for ww in lw]',其中lw是边缘权重,仍然不知道原始代码为什么没有 '正确' 编码它们的厚度。 - pceccon
nx.draw_networkx_edges 不会绘制自环。 当 DiGraph 包含自环时,传递给 nx.draw_networkx_edges 的权重必须跳过自环权重。否则,权重与绘制的边会不同步。 - unutbu

网页内容由stack overflow 提供, 点击上面的
可以查看英文原文,
原文链接