Networkx - 根据边属性更改颜色/宽度 - 不一致的结果

64

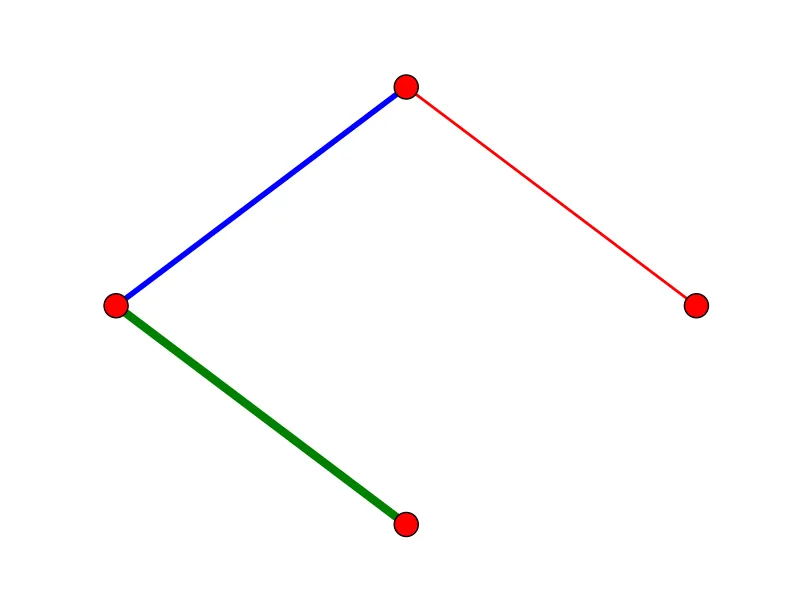
我成功地生成了图表,但在进行更多的测试时发现以下两行代码产生了不一致的结果:

colors = [h.edge[i][j]['color'] for (i,j) in h.edges_iter()]
widths = [h.edge[i][j]['width'] for (i,j) in h.edges_iter()]
nx.draw_circular(h, edge_color=colors, width=widths)

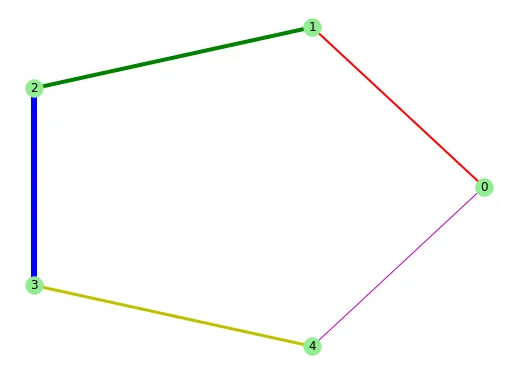
这种方法会产生一致的输出,而以下的方法会根据边缘顺序产生错误的颜色/大小:

colors = list(nx.get_edge_attributes(h,'color').values())
widths = list(nx.get_edge_attributes(h,'width').values())
nx.draw_circular(h, edge_color=colors, width=widths)

然而,我看上面两行代码都依赖于函数调用按边的顺序返回属性。为什么会有不同的结果呢?

使用 h[][][] 来访问属性感觉有点笨拙,能否通过点表示法来访问呢,比如说 edge.color for edge in h.edges()

还是我漏掉了什么?

3个回答

92

在绘图函数中传递边的顺序很重要。如果您不使用“edges”关键字指定,将会得到G.edges()的默认顺序。最安全的做法是明确地给出参数,例如:

import networkx as nx

G = nx.Graph()
G.add_edge(1,2,color='r',weight=2)
G.add_edge(2,3,color='b',weight=4)
G.add_edge(3,4,color='g',weight=6)

pos = nx.circular_layout(G)

edges = G.edges()
colors = [G[u][v]['color'] for u,v in edges]
weights = [G[u][v]['weight'] for u,v in edges]

nx.draw(G, pos, edges=edges, edge_color=colors, width=weights)
这会导致输出结果如下: 在此输入图像描述

8
收到无效参数错误:edges - 运行Python3 - SCBuergel
1
@SCBuergel 边缘参数可以省略。 - SumakuTension

28

字典是NetworkX图使用的底层数据结构,在Python 3.7+中,它们保持插入顺序

这意味着我们可以安全地使用nx.get_edge_attributes来检索边属性,因为我们保证在每次运行Graph.edges()(被get_edge_attributes在内部调用)中具有相同的边缘顺序。

因此,在绘制时,我们可以直接从get_edge_attributes返回的结果中设置属性,例如edge_colorwidth。下面是一个例子:

G = nx.Graph()
G.add_edge(0,1,color='r',weight=2)
G.add_edge(1,2,color='g',weight=4)
G.add_edge(2,3,color='b',weight=6)
G.add_edge(3,4,color='y',weight=3)
G.add_edge(4,0,color='m',weight=1)

colors = nx.get_edge_attributes(G,'color').values()
weights = nx.get_edge_attributes(G,'weight').values()

pos = nx.circular_layout(G)
nx.draw(G, pos, 
        edge_color=colors, 
        width=list(weights),
        with_labels=True,
        node_color='lightgreen')

这里输入图片描述


我需要将权重类型更改为列表才能使其工作 weights = list(nx.get_edge_attributes(G,'weight').values()) - Tobias P. G.
2
是的,请注意,当在nx.draw中绘制时,我会从中构建一个列表。@tobias - yatu

0

如果你想避免手动添加边缘颜色、透明度和宽度,你可能会发现这个函数很有用:

def rgb_to_hex(rgb):
    return '#%02x%02x%02x' % rgb

adjacency_matrix = np.array([[0, 0, 0.5], [1, 0, 1], [1, 0.5, 0]]))
n_graphs = 5
fig, axs = plt.subplots(1, len(n_graphs), figsize=(19,2.5)) 

for graph in range(n_graphs):   

    pos = {0: (1, 0.9), 1: (0.9, 1), 2: (1.1, 1)} 

    # draw DAG graph from adjacency matrix 
    gr = nx.from_numpy_matrix(adjacency_matrix, create_using=nx.DiGraph)
    weights = nx.get_edge_attributes(gr, "weight")
  
    # adding nodes 
    all_rows = range(0, adjacency_matrix.shape[0])
    for n in all_rows:
        gr.add_node(n)
    
    # getting edges 
    edges = gr.edges()
      
    # weight and color of edges 
    scaling_factor = 4 # to emphasise differences 
    alphas = [weights[edge] * scaling_factor for edge in edges]
    colors = [rgb_to_hex(tuple(np.repeat(int(255 * (1- 
    weights[edge])),3))) for edge in edges]
    
    # draw graph 
    nx.draw(gr, 
            pos, 
            ax=axs[graph],
            edgecolors='black', 
            node_color='white', 
            node_size=2000, 
            labels={0: "A", 1: "B", 2: "C"},
            font_weight='bold',
            linewidths=2,
            with_labels=True,
            connectionstyle="arc3,rad=0.15",
            edge_color=colors,
            width=alphas)

  
plt.tight_layout()

这使您可以从邻接矩阵中获取边缘属性,然后根据这些属性创建边缘权重/透明度和颜色。 - Jan-Philipp Fränken

网页内容由stack overflow 提供, 点击上面的
可以查看英文原文,
原文链接