这是我的片段:
output$map <- renderHighchart({
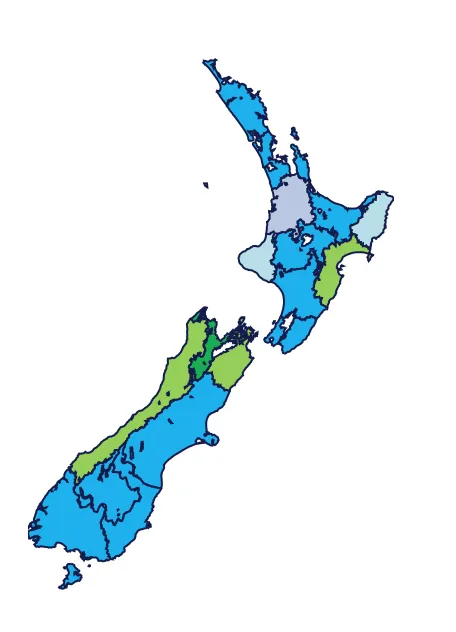
region_map = hcmap("countries/nz/nz-all")
highchart(type = "map") %>%
hc_title(text = "Average") %>%
hc_add_series_map(map = region_map, df = data1, joinBy = "name", value = "LTA", borderColor = "#141B4D",
color = "color",
showInLegend = TRUE,
borderWidth = 1)
) %>%
hc_tooltip(useHTML = TRUE, headerFormat ="", pointFormat = "{point.name} <br> LTA: {point.value}") %>%
})
这是我的数据:
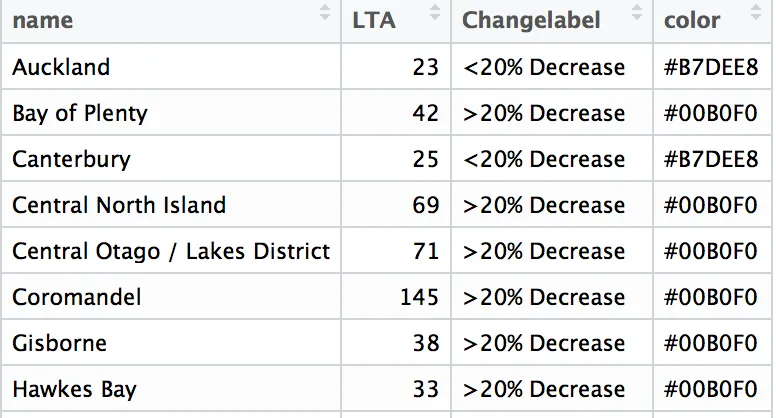
structure(list(name = c("Auckland", "Bay of Plenty", "Canterbury",
"Central North Island", "Central Otago / Lakes District", "Coromandel"
), LTA = c(23, 42, 25, 69, 71, 145), Changelabel = c("<20% Decrease",
">20% Decrease", "<20% Decrease", ">20% Decrease", ">20% Decrease",
">20% Decrease"), color = c("#B7DEE8", "#00B0F0", "#B7DEE8",
"#00B0F0", "#00B0F0", "#00B0F0")), .Names = c("name", "LTA",
"Changelabel", "color"), row.names = c(NA, 6L), class = "data.frame")
一切都很好,但是当我在此启用图例时,它会给我渐变色,而不考虑我使用的颜色列,如何指定颜色列与 changelabel 作为图例呢?
<20% Decrease - color (#B7DEE8)
>20% Decrease - color (#00B0F0)
output$map可以简写为map,对吧?最后,region_map的名称也找不到。我必须说:这些地图问题非常有趣! - storaged