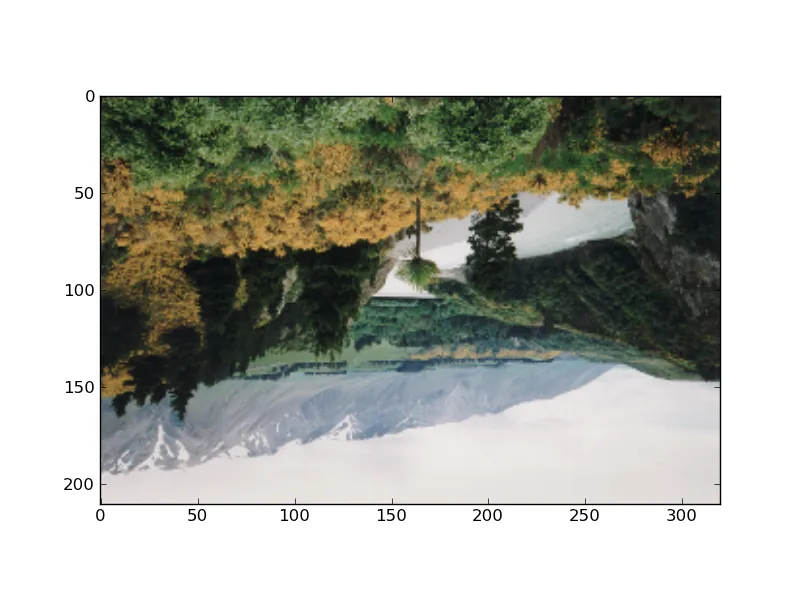
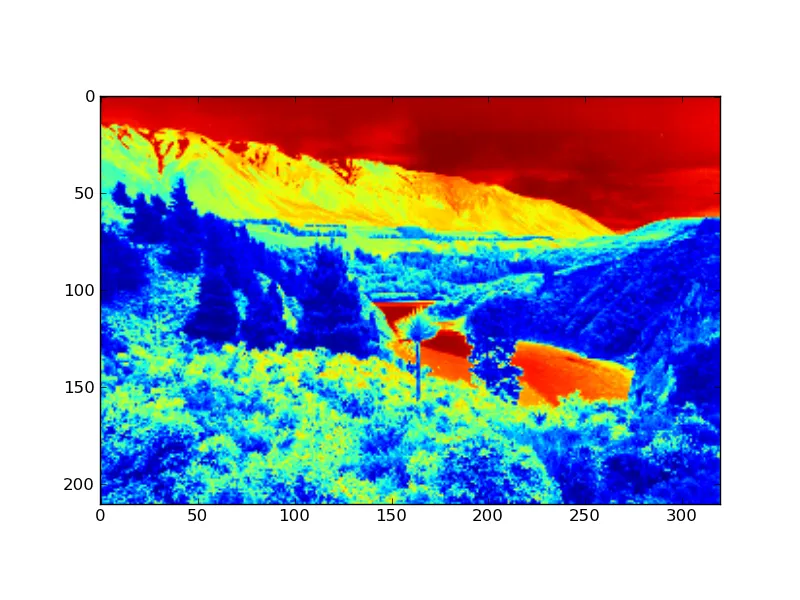
我想要在TIFF文件中操作RGB波段,并将灰度地图输出到matplotlib上。目前我的代码是这样的,但是我无法将其转换为灰度:
import scipy as N
import gdal
import sys
import matplotlib.pyplot as pyplot

tif = gdal.Open('filename.tif')

band1 = tif.GetRasterBand(1)
band2 = tif.GetRasterBand(2)
band3 = tif.GetRasterBand(3)


red = band1.ReadAsArray()
green = band2.ReadAsArray()
blue = band3.ReadAsArray()

gray = (0.299*red + 0.587*green + 0.114*blue)

pyplot.figure()
pyplot.imshow(gray)
pylab.show()
以下是数组:
[[255 255 255 ..., 237 237 251]
 [255 255 255 ..., 237 237 251]
 [255 255 255 ..., 237 237 251]
 ...,
 [237 237 237 ..., 237 237 251]
 [237 237 237 ..., 237 237 251]
 [242 242 242 ..., 242 242 252]]

[[255 255 255 ..., 239 239 251]
 [255 255 255 ..., 239 239 251]
 [255 255 255 ..., 239 239 251]
 ...,
 [239 239 239 ..., 239 239 251]
 [239 239 239 ..., 239 239 251]
 [243 243 243 ..., 243 243 252]]

[[255 255 255 ..., 234 234 250]
 [255 255 255 ..., 234 234 250]
 [255 255 255 ..., 234 234 250]
 ...,
 [234 234 234 ..., 234 234 250]
 [234 234 234 ..., 234 234 250]
 [239 239 239 ..., 239 239 251]]
有什么办法可以解决这个问题吗?
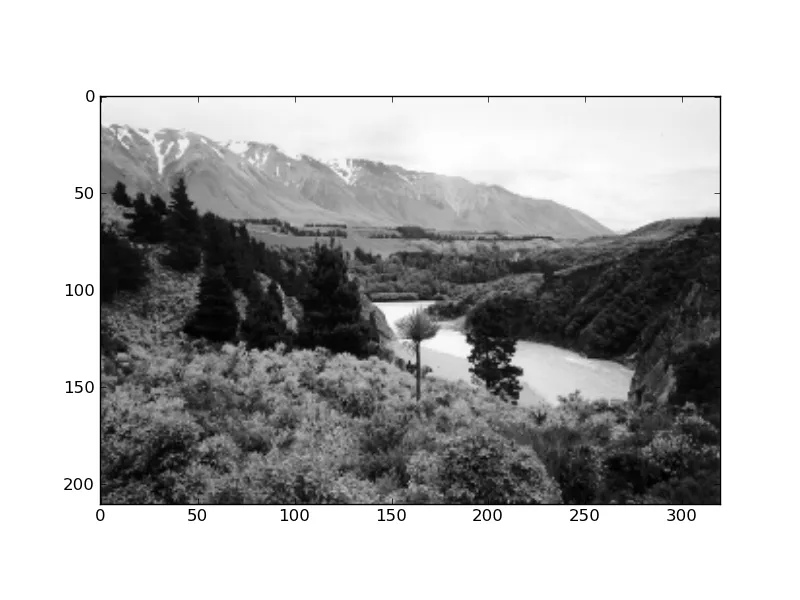
band1Array, band2Array, band3Array的用途是什么,它们没有被引用。该转换为灰度的公式看起来是正确的。 - lukecampbellredgreenblue的不就是这个吗? - lukecampbellpyplot.imshow(gray, cmap='gray');pyplot.show()。对我来说有效。 - cgohlke