有什么想法可以将两个相同的y轴标题合并成一个,并将这个y轴标题放置在图形中间?我已经成功地通过使用
plot_layout(guides = "collect")来合并图例,但是我似乎找不到类似于轴的东西。在这种情况下,我想将称为disp_disp_disp的两个轴标题合并成一个。

mtcars
library(ggplot2)
library(patchwork)
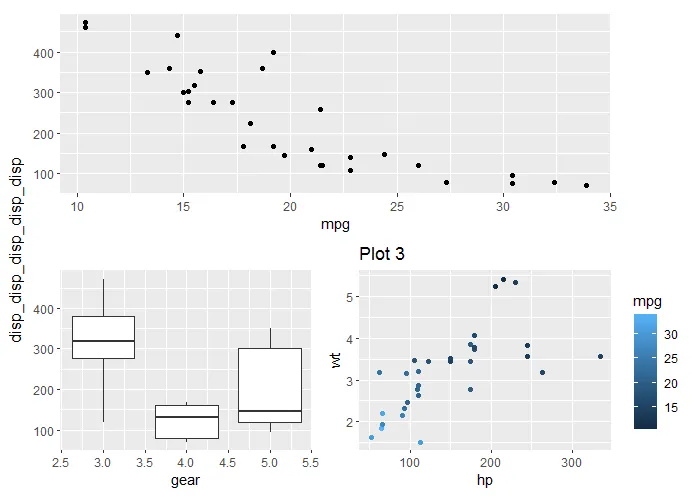
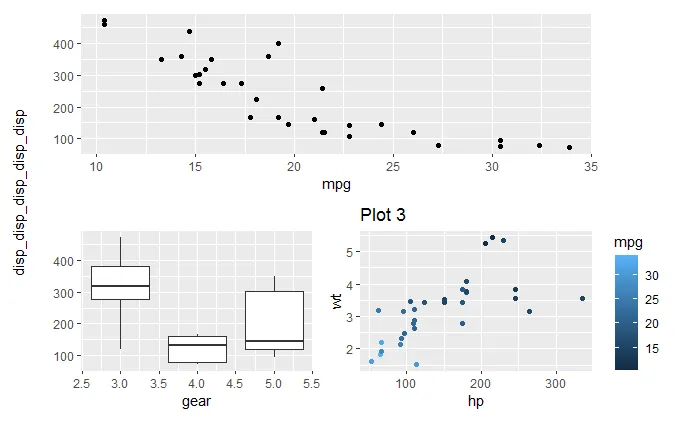
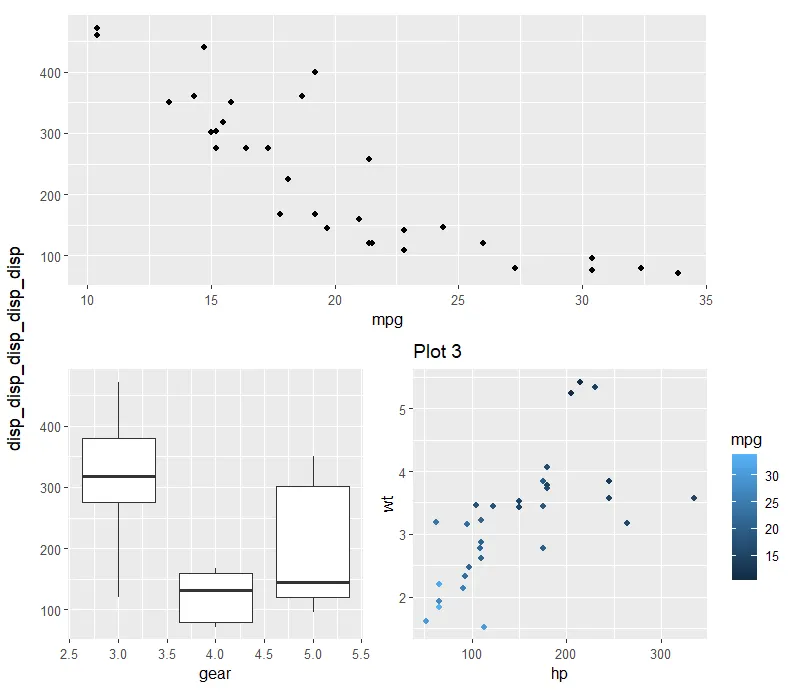
p1 <- ggplot(mtcars) +
geom_point(aes(mpg, disp)) +
labs(x = "mpg", y = "disp_disp_disp_disp_disp")
p2 <- ggplot(mtcars) +
geom_boxplot(aes(gear, disp, group = gear)) +
labs(x = "gear", y = "disp_disp_disp_disp_disp")
p3 <- ggplot(mtcars) +
geom_point(aes(hp, wt, colour = mpg)) +
ggtitle('Plot 3')
p1 / (p2 | p3)